29
/es/
es
AIzaSyAYiBZKx7MnpbEhh9jyipgxe19OcubqV5w
April 1, 2024
30424
Europe & Central Asia
ECS
false
2
1
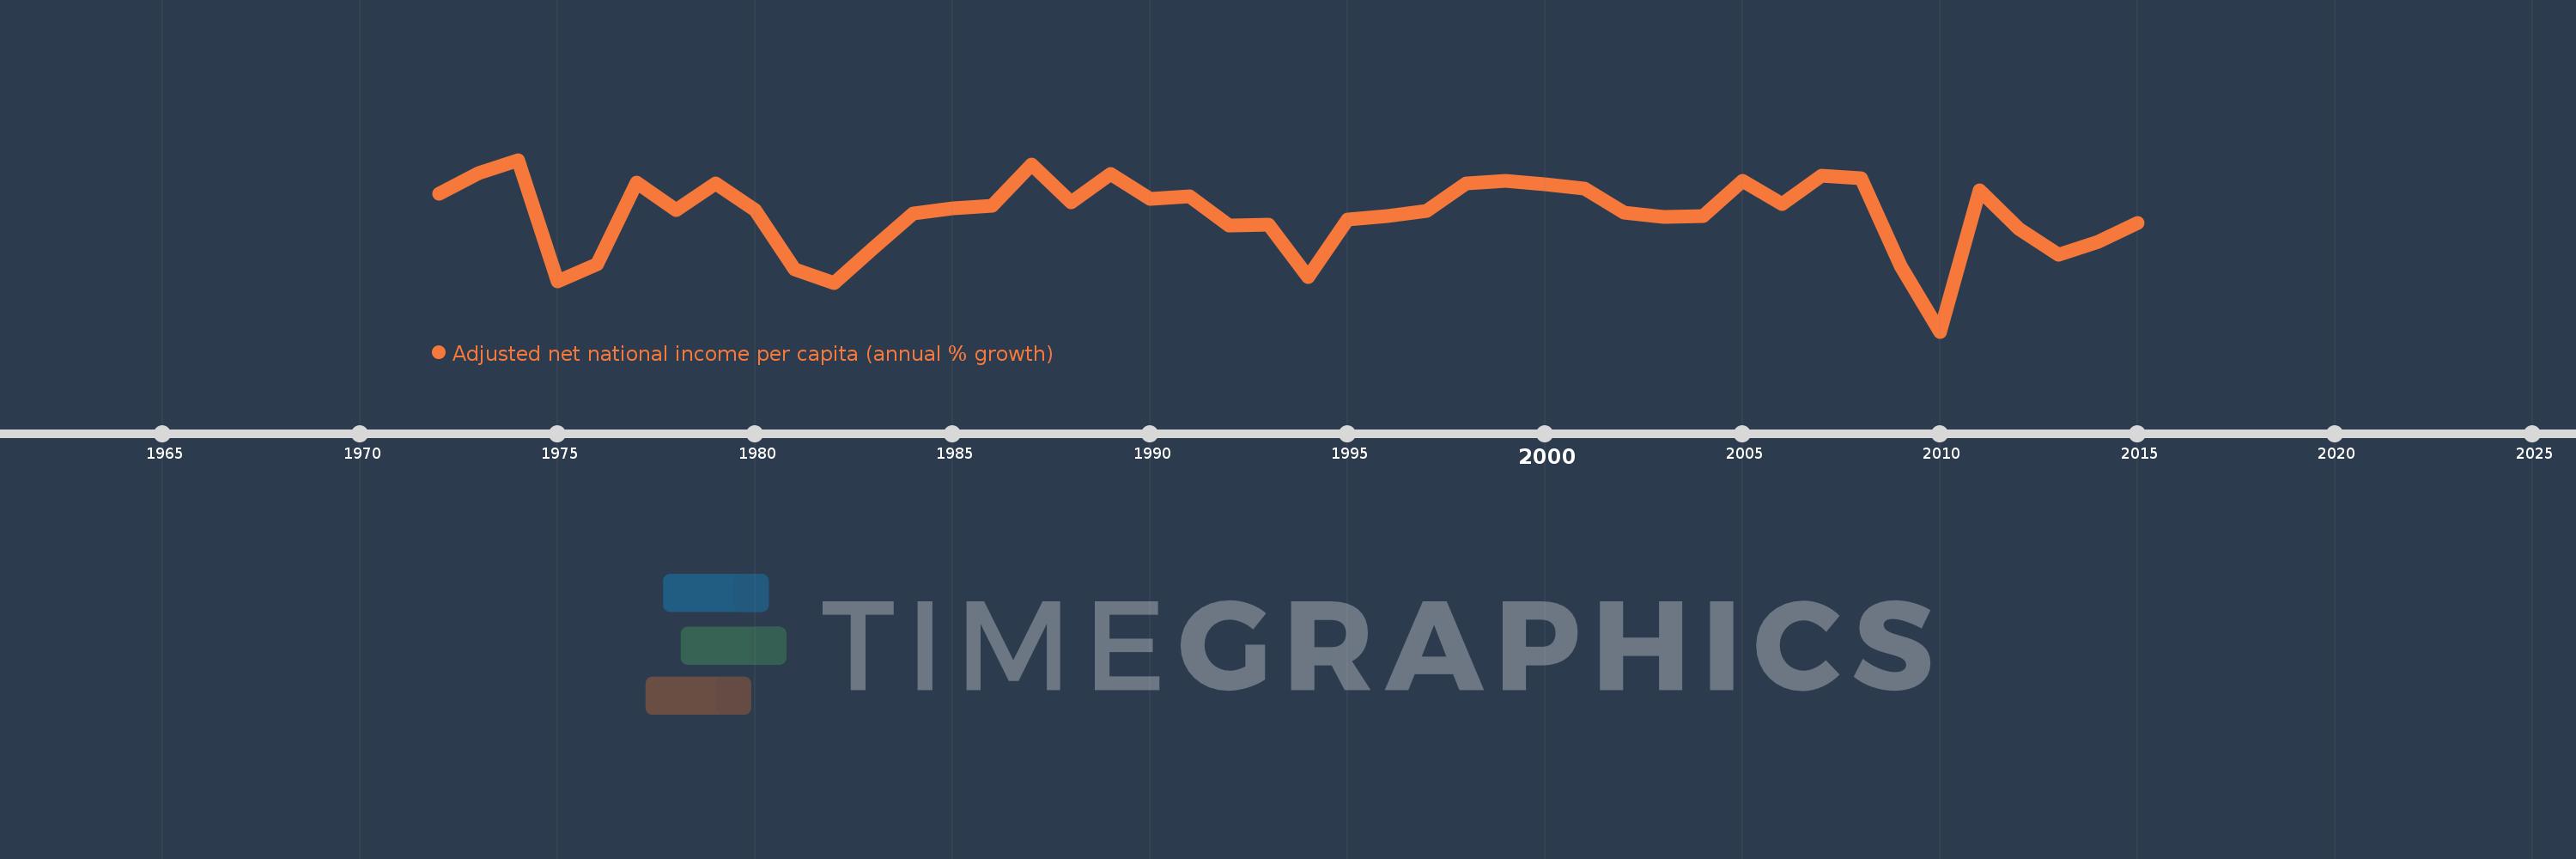
Adjusted net national income per capita (annual % growth)
2015,2014,2013,2012,2011,2010,2009,2008,2007,2006,2005,2004,2003,2002,2001,2000,1999,1998,1997,1996,1995,1994,1993,1992,1991,1990,1989,1988,1987,1986,1985,1984,1983,1982,1981,1980,1979,1978,1977,1976,1975,1974,1973,1972
Estas estadísticas en otros países:
línea de tiempo (timeline):
En esta escala de tiempo se presenta un gráfico de 1972 y 2015 de Europe & Central Asia. Los datos de 1971 están ausentes. El número de observaciones reales por fecha: 44.
Fuente (nombre):
Indicadores del desarrollo mundial
Fuente (organización):
World Bank staff estimates based on sources and methods in World Bank's "The Changing Wealth of Nations: Measuring Sustainable Development in the New Millennium" (2011).
Categorías:
Economy & Growth
Se ha actualizado:
23 abr 2017 año
Los indicadores de los cambios de valor en los últimos años
Mínimo:
-4.241
1 ene 2010 año
Máximo:
4.461
1 ene 1974 año
A la fecha de observación
Valor
Cambio absoluto
El cambio con respecto al valor anterior
1 ene 1972 año
2.723
+2.723
0.0%
1 ene 1973 año
3.798
+1.075
39.47%
1 ene 1974 año
4.461
+0.663
17.45%
1 ene 1975 año
-1.685
-6.146
-137.77%
1 ene 1976 año
-0.824
+0.861
-51.11%
1 ene 1977 año
3.291
+4.114
-499.5%
1 ene 1978 año
1.915
-1.376
-41.82%
1 ene 1979 año
3.269
+1.354
70.74%
1 ene 1980 año
1.931
-1.338
-40.93%
1 ene 1981 año
-1.104
-3.035
-157.19%
1 ene 1982 año
-1.778
-0.674
60.99%
1 ene 1983 año
0.011
+1.788
-100.6%
1 ene 1984 año
1.756
+1.745
16.46 mil%
1 ene 1985 año
1.985
+0.23
13.08%
1 ene 1986 año
2.143
+0.158
7.97%
1 ene 1987 año
4.216
+2.073
96.72%
1 ene 1988 año
2.31
-1.907
-45.22%
1 ene 1989 año
3.731
+1.421
61.52%
1 ene 1990 año
2.46
-1.27
-34.05%
1 ene 1991 año
2.604
+0.144
5.84%
1 ene 1992 año
1.13
-1.474
-56.61%
1 ene 1993 año
1.169
+0.039
3.46%
1 ene 1994 año
-1.458
-2.627
-224.75%
1 ene 1995 año
1.427
+2.885
-197.87%
1 ene 1996 año
1.62
+0.193
13.56%
1 ene 1997 año
1.883
+0.262
16.19%
1 ene 1998 año
3.27
+1.387
73.66%
1 ene 1999 año
3.402
+0.133
4.05%
1 ene 2000 año
3.209
-0.193
-5.68%
1 ene 2001 año
2.988
-0.221
-6.89%
1 ene 2002 año
1.801
-1.187
-39.71%
1 ene 2003 año
1.588
-0.213
-11.85%
1 ene 2004 año
1.606
+0.019
1.17%
1 ene 2005 año
3.411
+1.805
112.35%
1 ene 2006 año
2.202
-1.208
-35.43%
1 ene 2007 año
3.636
+1.433
65.07%
1 ene 2008 año
3.517
-0.119
-3.26%
1 ene 2009 año
-0.931
-4.448
-126.47%
1 ene 2010 año
-4.241
-3.31
355.53%
1 ene 2011 año
2.902
+7.143
-168.42%
1 ene 2012 año
0.94
-1.962
-67.6%
1 ene 2013 año
-0.332
-1.272
-135.26%
1 ene 2014 año
0.314
+0.645
-194.65%
1 ene 2015 año
1.284
+0.97
309.1%
Ranking de los países por los datos estadísticos actuales


Comentarios: