29
/de/
de
AIzaSyAYiBZKx7MnpbEhh9jyipgxe19OcubqV5w
April 1, 2024
66997
American Samoa
ASM
true
2
1
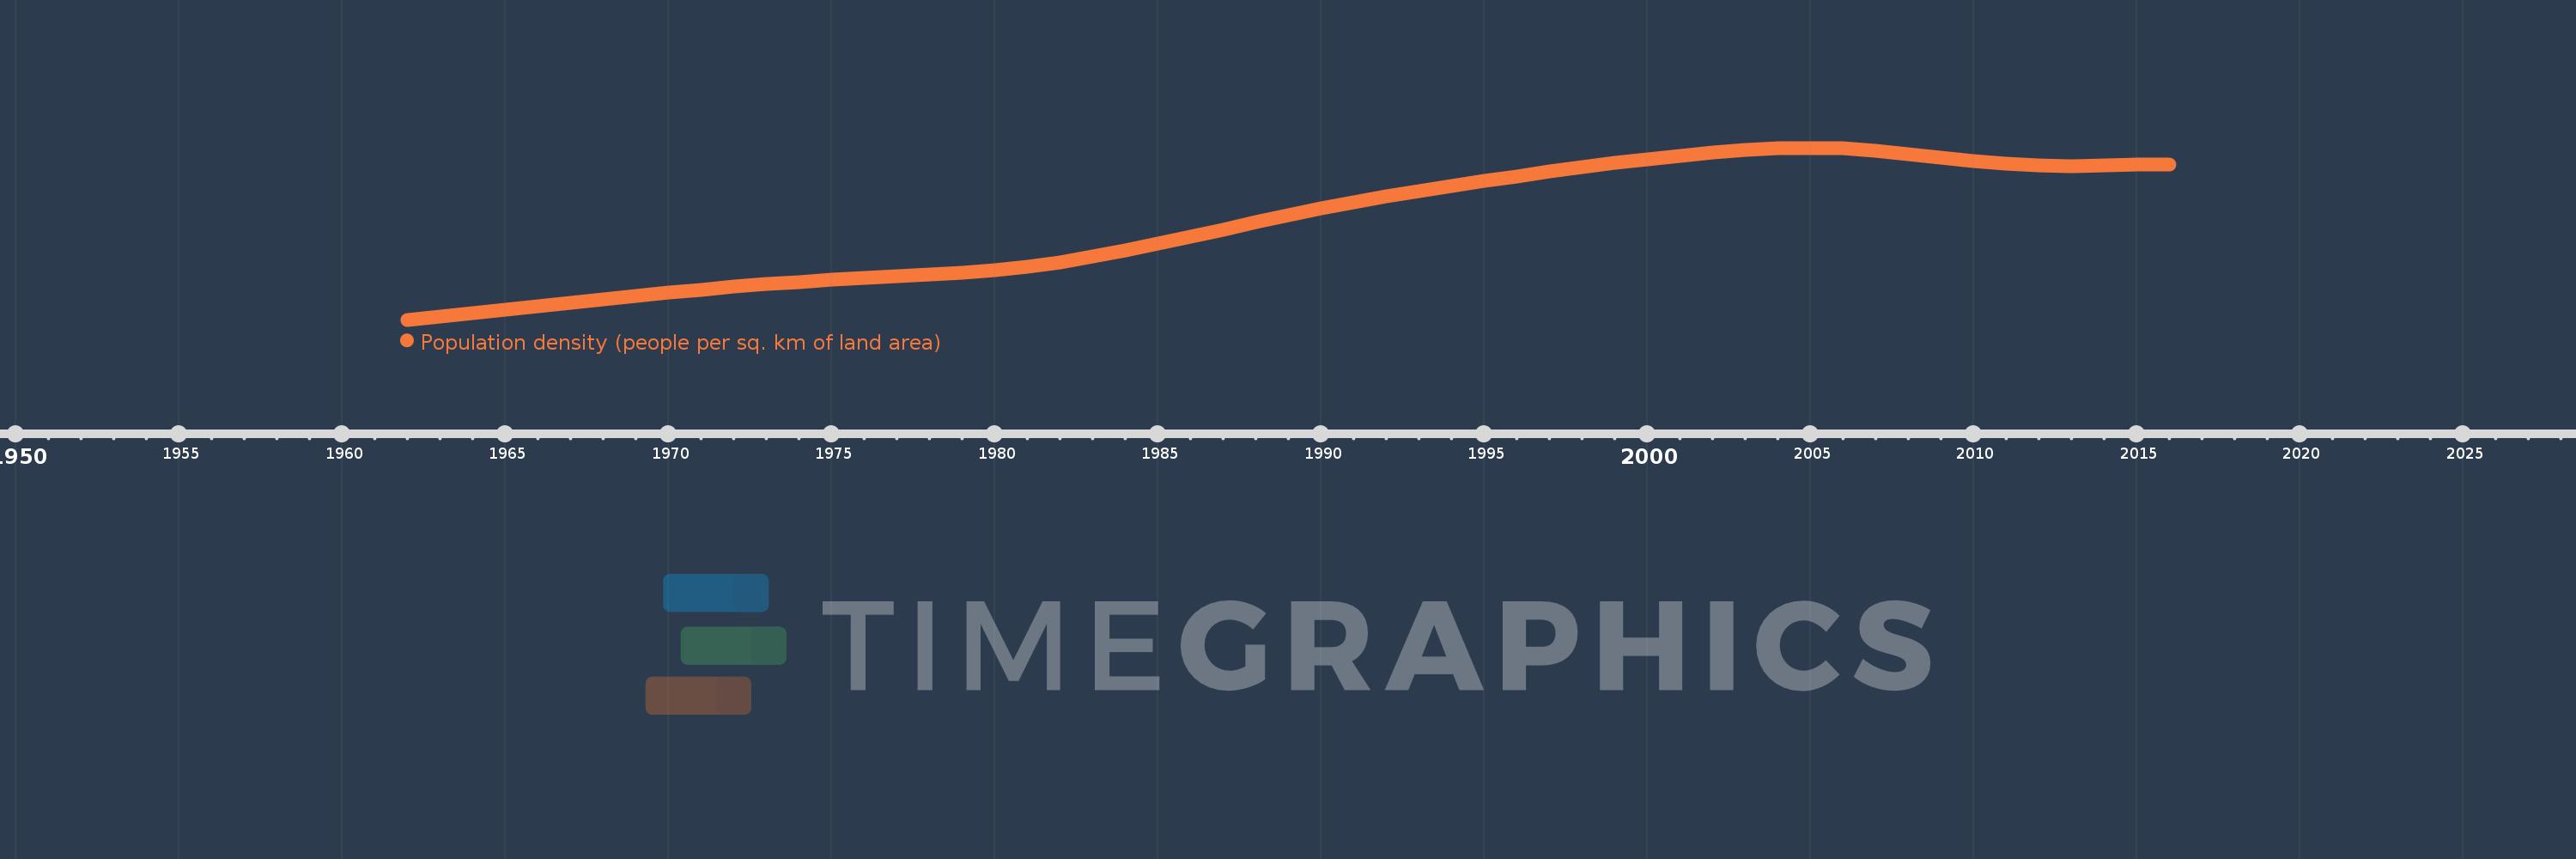
Population density (people per sq. km of land area)
2016,2015,2014,2013,2012,2011,2010,2009,2008,2007,2006,2005,2004,2003,2002,2001,2000,1999,1998,1997,1996,1995,1994,1993,1992,1991,1990,1989,1988,1987,1986,1985,1984,1983,1982,1981,1980,1979,1978,1977,1976,1975,1974,1973,1972,1971,1970,1969,1968,1967,1966,1965,1964,1963,1962
Diese Statistik in anderen Ländern:
AfghanistanAlbaniaAlgeriaAmerican SamoaAndorraAngolaAntigua and BarbudaArab WorldArgentinaArmeniaArubaAustraliaAustriaAzerbaijanBahamas, TheBahrainBangladeshBarbadosBelarusBelgiumBelizeBeninBermudaBhutanBoliviaBosnia and HerzegovinaBotswanaBrazilBritish Virgin IslandsBrunei DarussalamBulgariaBurkina FasoBurundiCabo VerdeCambodiaCameroonCanadaCaribbean small statesCayman IslandsCentral African RepublicCentral Europe and the BalticsChadChannel IslandsChileChinaColombiaComorosCongo, Dem. Rep.Congo, Rep.Costa RicaCote d'IvoireCroatiaCubaCuracaoCyprusCzech RepublicDenmarkDjiboutiDominicaDominican RepublicEarly-demographic dividendEast Asia & PacificEast Asia & Pacific (excluding high income)East Asia & Pacific (IDA & IBRD countries)EcuadorEgypt, Arab Rep.El SalvadorEquatorial GuineaEritreaEstoniaEthiopiaEuro areaEurope & Central AsiaEurope & Central Asia (excluding high income)Europe & Central Asia (IDA & IBRD countries)European UnionFaroe IslandsFijiFinlandFragile and conflict affected situationsFranceFrench PolynesiaGabonGambia, TheGeorgiaGermanyGhanaGibraltarGreeceGreenlandGrenadaGuamGuatemalaGuineaGuinea-BissauGuyanaHaitiHeavily indebted poor countries (HIPC)High incomeHondurasHong Kong SAR, ChinaHungaryIBRD onlyIcelandIDA & IBRD totalIDA blendIDA onlyIDA totalIndiaIndonesiaIran, Islamic Rep.IraqIrelandIsle of ManIsraelItalyJamaicaJapanJordanKazakhstanKenyaKiribatiKorea, Dem. People’s Rep.Korea, Rep.KosovoKuwaitKyrgyz RepublicLao PDRLate-demographic dividendLatin America & Caribbean Latin America & Caribbean (excluding high income)Latin America & the Caribbean (IDA & IBRD countries)LatviaLeast developed countries: UN classificationLebanonLesothoLiberiaLibyaLiechtensteinLithuaniaLow & middle incomeLow incomeLower middle incomeLuxembourgMacao SAR, ChinaMacedonia, FYRMadagascarMalawiMalaysiaMaldivesMaliMaltaMarshall IslandsMauritaniaMauritiusMexicoMicronesia, Fed. Sts.Middle East & North AfricaMiddle East & North Africa (excluding high income)Middle East & North Africa (IDA & IBRD countries)Middle incomeMoldovaMonacoMongoliaMontenegroMoroccoMozambiqueMyanmarNamibiaNauruNepalNetherlandsNew CaledoniaNew ZealandNicaraguaNigerNigeriaNorth AmericaNorthern Mariana IslandsNorwayOECD membersOmanOther small statesPacific island small statesPakistanPalauPanamaPapua New GuineaParaguayPeruPhilippinesPolandPortugalPost-demographic dividendPre-demographic dividendPuerto RicoQatarRomaniaRussian FederationRwandaSamoaSan MarinoSao Tome and PrincipeSaudi ArabiaSenegalSerbiaSeychellesSierra LeoneSingaporeSint Maarten (Dutch part)Slovak RepublicSloveniaSmall statesSolomon IslandsSomaliaSouth AfricaSouth AsiaSouth Asia (IDA & IBRD)SpainSri LankaSt. Kitts and NevisSt. LuciaSt. Martin (French part)St. Vincent and the GrenadinesSub-Saharan Africa Sub-Saharan Africa (excluding high income)Sub-Saharan Africa (IDA & IBRD countries)SudanSurinameSwazilandSwedenSwitzerlandSyrian Arab RepublicTajikistanTanzaniaThailandTimor-LesteTogoTongaTrinidad and TobagoTunisiaTurkeyTurkmenistanTurks and Caicos IslandsTuvaluUgandaUkraineUnited Arab EmiratesUnited KingdomUnited StatesUpper middle incomeUruguayUzbekistanVanuatuVenezuela, RBVietnamVirgin Islands (U.S.)West Bank and GazaWorldYemen, Rep.ZambiaZimbabwe Zeitlinie:
Diese Zeitleiste vorliegt die Graphik ab 1962 J. bis 2016 J. American Samoa. Die Angaben bis 1961 J. sind nicht vorhanden. Die Zahl aktueller Beobachtungen nach Daten: 55.
Die Quelle (Bezeichnung):
Kennzahlen der Weltentwicklung
Die Quelle (Einrichtung):
Food and Agriculture Organization and World Bank population estimates.
Kategorien:
Urban Development
Es wurde aktualisiert:
23 Apr 2017 Jahr
Kennzahlen der Wertänderungen vom Jahr zum Jahr
Minimum:
102.39
1 Jan 1962 Jahr
Maximum:
296.31
1 Jan 2005 Jahr
Zum Datum der Beobachtung
Wert
Absolute Veränderung
Die Veränderung bezüglich dem vorherigen Wert
1 Jan 1962 Jahr
102.39
+102.39
0.0%
1 Jan 1963 Jahr
105.59
+3.2
3.13%
1 Jan 1964 Jahr
109.415
+3.825
3.62%
1 Jan 1965 Jahr
113.505
+4.09
3.74%
1 Jan 1966 Jahr
117.59
+4.085
3.6%
1 Jan 1967 Jahr
121.6
+4.01
3.41%
1 Jan 1968 Jahr
125.58
+3.98
3.27%
1 Jan 1969 Jahr
129.43
+3.85
3.07%
1 Jan 1970 Jahr
133.075
+3.645
2.82%
1 Jan 1971 Jahr
136.46
+3.385
2.54%
1 Jan 1972 Jahr
139.58
+3.12
2.29%
1 Jan 1973 Jahr
142.45
+2.87
2.06%
1 Jan 1974 Jahr
145.07
+2.62
1.84%
1 Jan 1975 Jahr
147.455
+2.385
1.64%
1 Jan 1976 Jahr
149.66
+2.205
1.5%
1 Jan 1977 Jahr
151.625
+1.965
1.31%
1 Jan 1978 Jahr
153.45
+1.825
1.2%
1 Jan 1979 Jahr
155.525
+2.075
1.35%
1 Jan 1980 Jahr
158.35
+2.825
1.82%
1 Jan 1981 Jahr
162.28
+3.93
2.48%
1 Jan 1982 Jahr
167.44
+5.16
3.18%
1 Jan 1983 Jahr
173.7
+6.26
3.74%
1 Jan 1984 Jahr
180.825
+7.125
4.1%
1 Jan 1985 Jahr
188.435
+7.61
4.21%
1 Jan 1986 Jahr
196.235
+7.8
4.14%
1 Jan 1987 Jahr
204.175
+7.94
4.05%
1 Jan 1988 Jahr
212.24
+8.065
3.95%
1 Jan 1989 Jahr
220.245
+8.005
3.77%
1 Jan 1990 Jahr
227.955
+7.71
3.5%
1 Jan 1991 Jahr
235.22
+7.265
3.19%
1 Jan 1992 Jahr
241.895
+6.675
2.84%
1 Jan 1993 Jahr
247.985
+6.09
2.52%
1 Jan 1994 Jahr
253.625
+5.64
2.27%
1 Jan 1995 Jahr
259.035
+5.41
2.13%
1 Jan 1996 Jahr
264.37
+5.335
2.06%
1 Jan 1997 Jahr
269.63
+5.26
1.99%
1 Jan 1998 Jahr
274.71
+5.08
1.88%
1 Jan 1999 Jahr
279.495
+4.785
1.74%
1 Jan 2000 Jahr
283.84
+4.345
1.55%
1 Jan 2001 Jahr
287.61
+3.77
1.33%
1 Jan 2002 Jahr
290.88
+3.27
1.14%
1 Jan 2003 Jahr
293.645
+2.765
0.95%
1 Jan 2004 Jahr
295.585
+1.94
0.66%
1 Jan 2005 Jahr
296.31
+0.725
0.25%
1 Jan 2006 Jahr
295.585
-0.725
-0.24%
1 Jan 2007 Jahr
293.24
-2.345
-0.79%
1 Jan 2008 Jahr
289.52
-3.72
-1.27%
1 Jan 2009 Jahr
285.155
-4.365
-1.51%
1 Jan 2010 Jahr
281.13
-4.025
-1.41%
1 Jan 2011 Jahr
278.18
-2.95
-1.05%
1 Jan 2012 Jahr
276.58
-1.6
-0.58%
1 Jan 2013 Jahr
276.135
-0.445
-0.16%
1 Jan 2014 Jahr
276.51
+0.375
0.14%
1 Jan 2015 Jahr
277.17
+0.66
0.24%
1 Jan 2016 Jahr
277.69
+0.52
0.19%
Bewertung der Länder gemäß mit laufender Statistik nach Jahren


Kommentare: