29
/de/
de
AIzaSyAYiBZKx7MnpbEhh9jyipgxe19OcubqV5w
April 1, 2024
200826
Montenegro
MNE
true
2
1
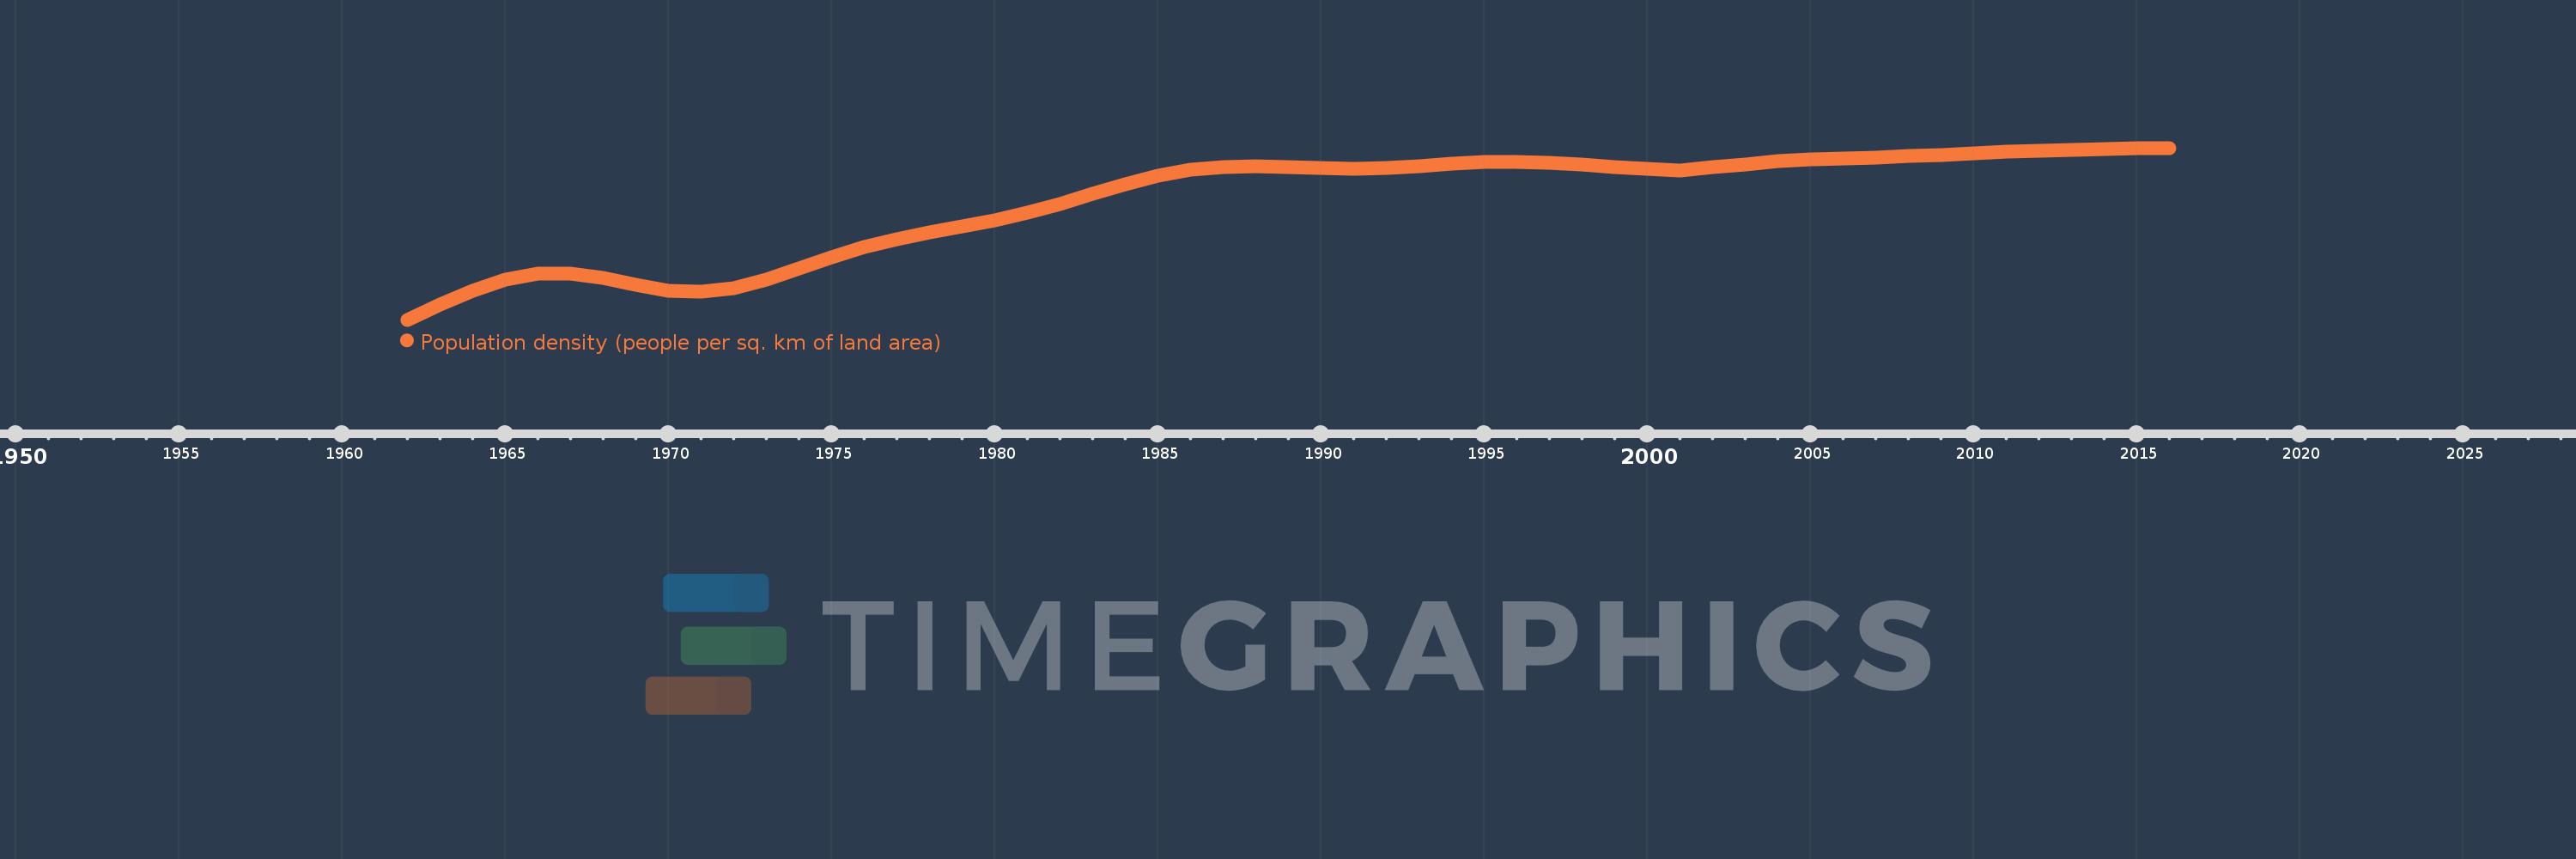
Population density (people per sq. km of land area)
2016,2015,2014,2013,2012,2011,2010,2009,2008,2007,2006,2005,2004,2003,2002,2001,2000,1999,1998,1997,1996,1995,1994,1993,1992,1991,1990,1989,1988,1987,1986,1985,1984,1983,1982,1981,1980,1979,1978,1977,1976,1975,1974,1973,1972,1971,1970,1969,1968,1967,1966,1965,1964,1963,1962
Diese Statistik in anderen Ländern:
AfghanistanAlbaniaAlgeriaAmerican SamoaAndorraAngolaAntigua and BarbudaArab WorldArgentinaArmeniaArubaAustraliaAustriaAzerbaijanBahamas, TheBahrainBangladeshBarbadosBelarusBelgiumBelizeBeninBermudaBhutanBoliviaBosnia and HerzegovinaBotswanaBrazilBritish Virgin IslandsBrunei DarussalamBulgariaBurkina FasoBurundiCabo VerdeCambodiaCameroonCanadaCaribbean small statesCayman IslandsCentral African RepublicCentral Europe and the BalticsChadChannel IslandsChileChinaColombiaComorosCongo, Dem. Rep.Congo, Rep.Costa RicaCote d'IvoireCroatiaCubaCuracaoCyprusCzech RepublicDenmarkDjiboutiDominicaDominican RepublicEarly-demographic dividendEast Asia & PacificEast Asia & Pacific (excluding high income)East Asia & Pacific (IDA & IBRD countries)EcuadorEgypt, Arab Rep.El SalvadorEquatorial GuineaEritreaEstoniaEthiopiaEuro areaEurope & Central AsiaEurope & Central Asia (excluding high income)Europe & Central Asia (IDA & IBRD countries)European UnionFaroe IslandsFijiFinlandFragile and conflict affected situationsFranceFrench PolynesiaGabonGambia, TheGeorgiaGermanyGhanaGibraltarGreeceGreenlandGrenadaGuamGuatemalaGuineaGuinea-BissauGuyanaHaitiHeavily indebted poor countries (HIPC)High incomeHondurasHong Kong SAR, ChinaHungaryIBRD onlyIcelandIDA & IBRD totalIDA blendIDA onlyIDA totalIndiaIndonesiaIran, Islamic Rep.IraqIrelandIsle of ManIsraelItalyJamaicaJapanJordanKazakhstanKenyaKiribatiKorea, Dem. People’s Rep.Korea, Rep.KosovoKuwaitKyrgyz RepublicLao PDRLate-demographic dividendLatin America & Caribbean Latin America & Caribbean (excluding high income)Latin America & the Caribbean (IDA & IBRD countries)LatviaLeast developed countries: UN classificationLebanonLesothoLiberiaLibyaLiechtensteinLithuaniaLow & middle incomeLow incomeLower middle incomeLuxembourgMacao SAR, ChinaMacedonia, FYRMadagascarMalawiMalaysiaMaldivesMaliMaltaMarshall IslandsMauritaniaMauritiusMexicoMicronesia, Fed. Sts.Middle East & North AfricaMiddle East & North Africa (excluding high income)Middle East & North Africa (IDA & IBRD countries)Middle incomeMoldovaMonacoMongoliaMontenegroMoroccoMozambiqueMyanmarNamibiaNauruNepalNetherlandsNew CaledoniaNew ZealandNicaraguaNigerNigeriaNorth AmericaNorthern Mariana IslandsNorwayOECD membersOmanOther small statesPacific island small statesPakistanPalauPanamaPapua New GuineaParaguayPeruPhilippinesPolandPortugalPost-demographic dividendPre-demographic dividendPuerto RicoQatarRomaniaRussian FederationRwandaSamoaSan MarinoSao Tome and PrincipeSaudi ArabiaSenegalSerbiaSeychellesSierra LeoneSingaporeSint Maarten (Dutch part)Slovak RepublicSloveniaSmall statesSolomon IslandsSomaliaSouth AfricaSouth AsiaSouth Asia (IDA & IBRD)SpainSri LankaSt. Kitts and NevisSt. LuciaSt. Martin (French part)St. Vincent and the GrenadinesSub-Saharan Africa Sub-Saharan Africa (excluding high income)Sub-Saharan Africa (IDA & IBRD countries)SudanSurinameSwazilandSwedenSwitzerlandSyrian Arab RepublicTajikistanTanzaniaThailandTimor-LesteTogoTongaTrinidad and TobagoTunisiaTurkeyTurkmenistanTurks and Caicos IslandsTuvaluUgandaUkraineUnited Arab EmiratesUnited KingdomUnited StatesUpper middle incomeUruguayUzbekistanVanuatuVenezuela, RBVietnamVirgin Islands (U.S.)West Bank and GazaWorldYemen, Rep.ZambiaZimbabwe Zeitlinie:
Diese Zeitleiste vorliegt die Graphik ab 1962 J. bis 2016 J. Montenegro. Die Angaben bis 1961 J. sind nicht vorhanden. Die Zahl aktueller Beobachtungen nach Daten: 55.
Die Quelle (Bezeichnung):
Kennzahlen der Weltentwicklung
Die Quelle (Einrichtung):
Food and Agriculture Organization and World Bank population estimates.
Kategorien:
Urban Development
Es wurde aktualisiert:
23 Apr 2017 Jahr
Kennzahlen der Wertänderungen vom Jahr zum Jahr
Minimum:
36.516
1 Jan 1962 Jahr
Maximum:
46.257
1 Jan 2016 Jahr
Zum Datum der Beobachtung
Wert
Absolute Veränderung
Die Veränderung bezüglich dem vorherigen Wert
1 Jan 1962 Jahr
36.516
+36.516
0.0%
1 Jan 1963 Jahr
37.365
+0.849
2.32%
1 Jan 1964 Jahr
38.172
+0.807
2.16%
1 Jan 1965 Jahr
38.792
+0.62
1.63%
1 Jan 1966 Jahr
39.132
+0.34
0.88%
1 Jan 1967 Jahr
39.139
+0.007
0.02%
1 Jan 1968 Jahr
38.87
-0.269
-0.69%
1 Jan 1969 Jahr
38.474
-0.395
-1.02%
1 Jan 1970 Jahr
38.167
-0.308
-0.8%
1 Jan 1971 Jahr
38.097
-0.069
-0.18%
1 Jan 1972 Jahr
38.323
+0.226
0.59%
1 Jan 1973 Jahr
38.794
+0.471
1.23%
1 Jan 1974 Jahr
39.422
+0.627
1.62%
1 Jan 1975 Jahr
40.067
+0.646
1.64%
1 Jan 1976 Jahr
40.631
+0.564
1.41%
1 Jan 1977 Jahr
41.083
+0.452
1.11%
1 Jan 1978 Jahr
41.455
+0.373
0.91%
1 Jan 1979 Jahr
41.789
+0.334
0.81%
1 Jan 1980 Jahr
42.148
+0.359
0.86%
1 Jan 1981 Jahr
42.573
+0.425
1.01%
1 Jan 1982 Jahr
43.081
+0.508
1.19%
1 Jan 1983 Jahr
43.643
+0.562
1.3%
1 Jan 1984 Jahr
44.201
+0.558
1.28%
1 Jan 1985 Jahr
44.675
+0.474
1.07%
1 Jan 1986 Jahr
45.011
+0.336
0.75%
1 Jan 1987 Jahr
45.183
+0.172
0.38%
1 Jan 1988 Jahr
45.215
+0.032
0.07%
1 Jan 1989 Jahr
45.161
-0.054
-0.12%
1 Jan 1990 Jahr
45.098
-0.063
-0.14%
1 Jan 1991 Jahr
45.083
-0.015
-0.03%
1 Jan 1992 Jahr
45.138
+0.054
0.12%
1 Jan 1993 Jahr
45.243
+0.105
0.23%
1 Jan 1994 Jahr
45.366
+0.123
0.27%
1 Jan 1995 Jahr
45.456
+0.091
0.2%
1 Jan 1996 Jahr
45.48
+0.024
0.05%
1 Jan 1997 Jahr
45.428
-0.053
-0.12%
1 Jan 1998 Jahr
45.317
-0.11
-0.24%
1 Jan 1999 Jahr
45.179
-0.138
-0.3%
1 Jan 2000 Jahr
45.056
-0.123
-0.27%
1 Jan 2001 Jahr
44.978
-0.078
-0.17%
1 Jan 2002 Jahr
45.159
+0.181
0.4%
1 Jan 2003 Jahr
45.34
+0.181
0.4%
1 Jan 2004 Jahr
45.522
+0.181
0.4%
1 Jan 2005 Jahr
45.602
+0.081
0.18%
1 Jan 2006 Jahr
45.67
+0.068
0.15%
1 Jan 2007 Jahr
45.727
+0.057
0.12%
1 Jan 2008 Jahr
45.79
+0.063
0.14%
1 Jan 2009 Jahr
45.871
+0.081
0.18%
1 Jan 2010 Jahr
45.97
+0.099
0.21%
1 Jan 2011 Jahr
46.054
+0.084
0.18%
1 Jan 2012 Jahr
46.103
+0.048
0.11%
1 Jan 2013 Jahr
46.141
+0.039
0.08%
1 Jan 2014 Jahr
46.186
+0.045
0.1%
1 Jan 2015 Jahr
46.231
+0.045
0.1%
1 Jan 2016 Jahr
46.257
+0.026
0.06%
Bewertung der Länder gemäß mit laufender Statistik nach Jahren


Kommentare: