29
/de/
de
AIzaSyAYiBZKx7MnpbEhh9jyipgxe19OcubqV5w
April 1, 2024
55080
Post-demographic dividend
PST
false
2
1
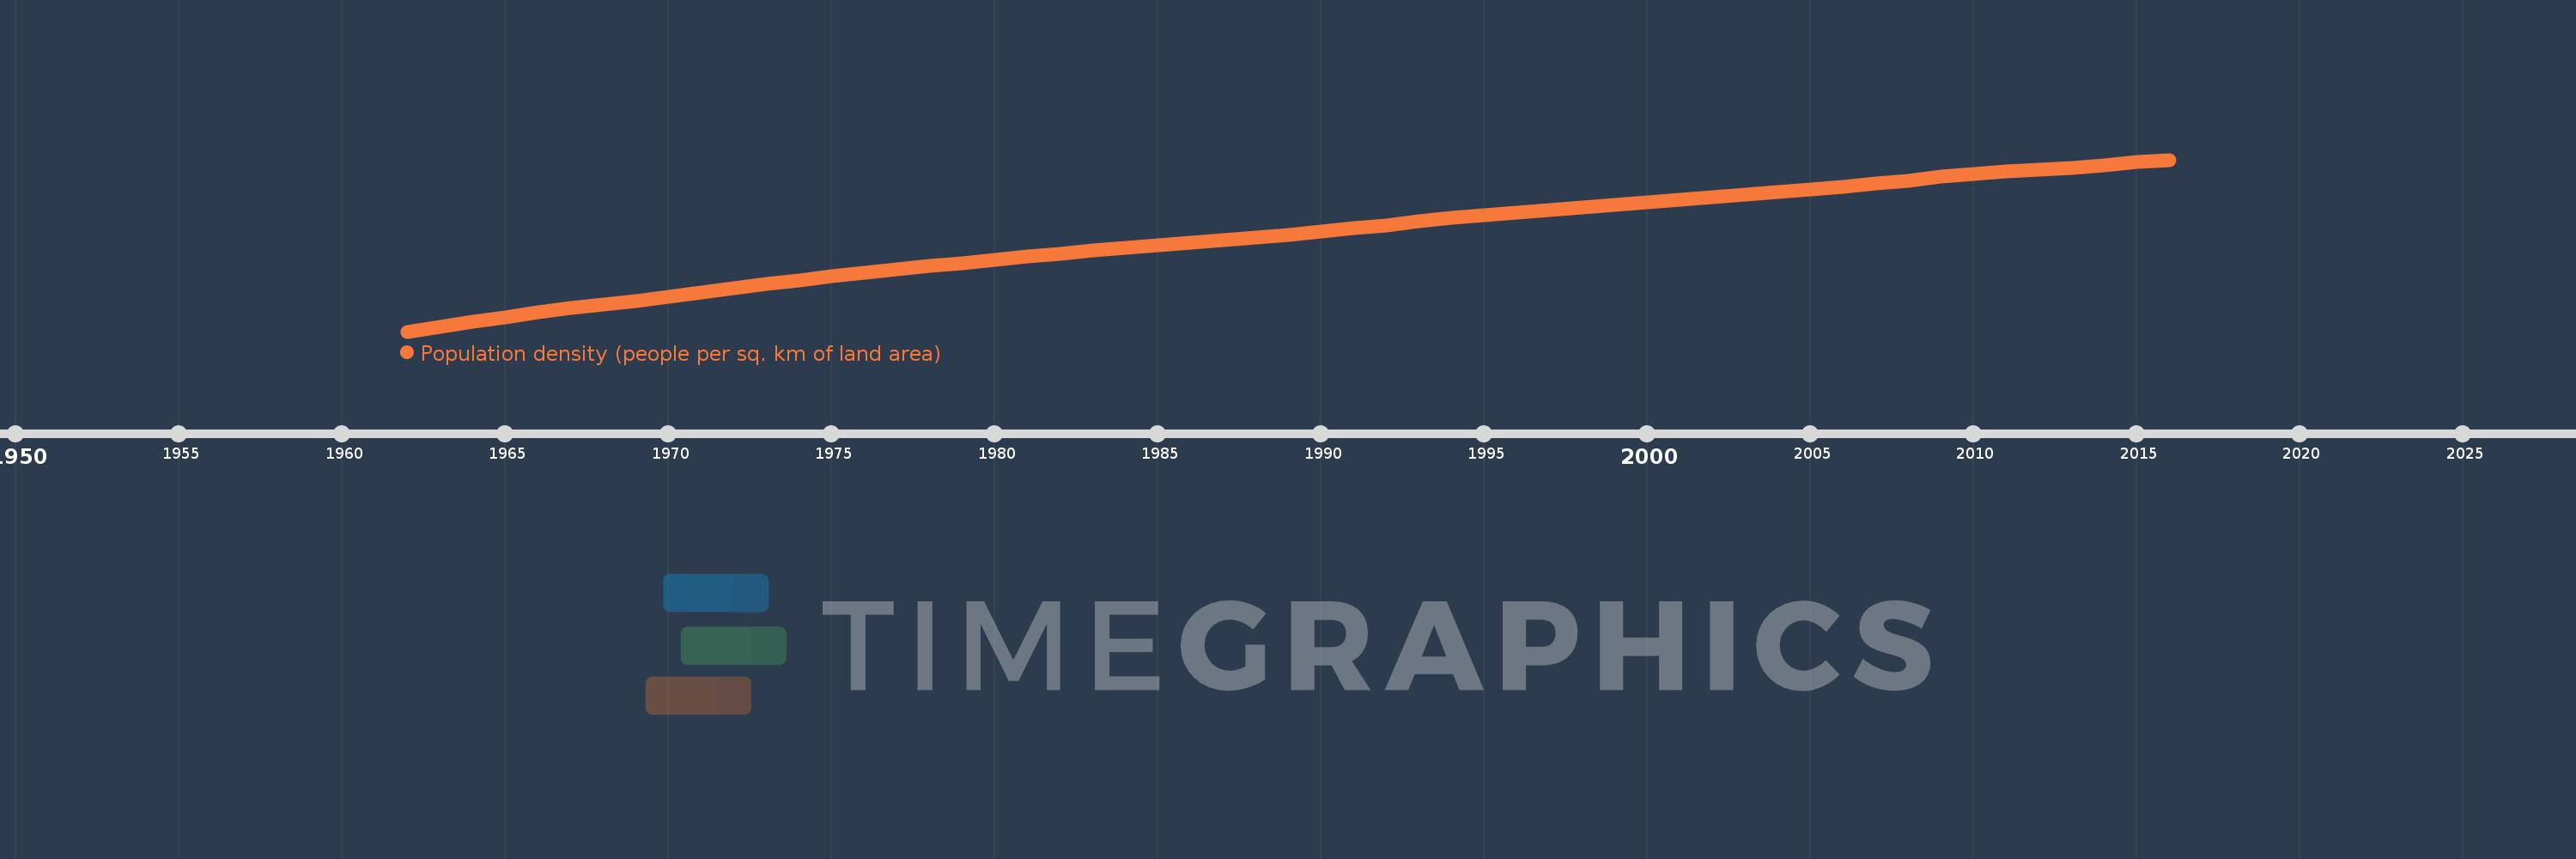
Population density (people per sq. km of land area)
2016,2015,2014,2013,2012,2011,2010,2009,2008,2007,2006,2005,2004,2003,2002,2001,2000,1999,1998,1997,1996,1995,1994,1993,1992,1991,1990,1989,1988,1987,1986,1985,1984,1983,1982,1981,1980,1979,1978,1977,1976,1975,1974,1973,1972,1971,1970,1969,1968,1967,1966,1965,1964,1963,1962
Diese Statistik in anderen Ländern:
AfghanistanAlbaniaAlgeriaAmerican SamoaAndorraAngolaAntigua and BarbudaArab WorldArgentinaArmeniaArubaAustraliaAustriaAzerbaijanBahamas, TheBahrainBangladeshBarbadosBelarusBelgiumBelizeBeninBermudaBhutanBoliviaBosnia and HerzegovinaBotswanaBrazilBritish Virgin IslandsBrunei DarussalamBulgariaBurkina FasoBurundiCabo VerdeCambodiaCameroonCanadaCaribbean small statesCayman IslandsCentral African RepublicCentral Europe and the BalticsChadChannel IslandsChileChinaColombiaComorosCongo, Dem. Rep.Congo, Rep.Costa RicaCote d'IvoireCroatiaCubaCuracaoCyprusCzech RepublicDenmarkDjiboutiDominicaDominican RepublicEarly-demographic dividendEast Asia & PacificEast Asia & Pacific (excluding high income)East Asia & Pacific (IDA & IBRD countries)EcuadorEgypt, Arab Rep.El SalvadorEquatorial GuineaEritreaEstoniaEthiopiaEuro areaEurope & Central AsiaEurope & Central Asia (excluding high income)Europe & Central Asia (IDA & IBRD countries)European UnionFaroe IslandsFijiFinlandFragile and conflict affected situationsFranceFrench PolynesiaGabonGambia, TheGeorgiaGermanyGhanaGibraltarGreeceGreenlandGrenadaGuamGuatemalaGuineaGuinea-BissauGuyanaHaitiHeavily indebted poor countries (HIPC)High incomeHondurasHong Kong SAR, ChinaHungaryIBRD onlyIcelandIDA & IBRD totalIDA blendIDA onlyIDA totalIndiaIndonesiaIran, Islamic Rep.IraqIrelandIsle of ManIsraelItalyJamaicaJapanJordanKazakhstanKenyaKiribatiKorea, Dem. People’s Rep.Korea, Rep.KosovoKuwaitKyrgyz RepublicLao PDRLate-demographic dividendLatin America & Caribbean Latin America & Caribbean (excluding high income)Latin America & the Caribbean (IDA & IBRD countries)LatviaLeast developed countries: UN classificationLebanonLesothoLiberiaLibyaLiechtensteinLithuaniaLow & middle incomeLow incomeLower middle incomeLuxembourgMacao SAR, ChinaMacedonia, FYRMadagascarMalawiMalaysiaMaldivesMaliMaltaMarshall IslandsMauritaniaMauritiusMexicoMicronesia, Fed. Sts.Middle East & North AfricaMiddle East & North Africa (excluding high income)Middle East & North Africa (IDA & IBRD countries)Middle incomeMoldovaMonacoMongoliaMontenegroMoroccoMozambiqueMyanmarNamibiaNauruNepalNetherlandsNew CaledoniaNew ZealandNicaraguaNigerNigeriaNorth AmericaNorthern Mariana IslandsNorwayOECD membersOmanOther small statesPacific island small statesPakistanPalauPanamaPapua New GuineaParaguayPeruPhilippinesPolandPortugalPost-demographic dividendPre-demographic dividendPuerto RicoQatarRomaniaRussian FederationRwandaSamoaSan MarinoSao Tome and PrincipeSaudi ArabiaSenegalSerbiaSeychellesSierra LeoneSingaporeSint Maarten (Dutch part)Slovak RepublicSloveniaSmall statesSolomon IslandsSomaliaSouth AfricaSouth AsiaSouth Asia (IDA & IBRD)SpainSri LankaSt. Kitts and NevisSt. LuciaSt. Martin (French part)St. Vincent and the GrenadinesSub-Saharan Africa Sub-Saharan Africa (excluding high income)Sub-Saharan Africa (IDA & IBRD countries)SudanSurinameSwazilandSwedenSwitzerlandSyrian Arab RepublicTajikistanTanzaniaThailandTimor-LesteTogoTongaTrinidad and TobagoTunisiaTurkeyTurkmenistanTurks and Caicos IslandsTuvaluUgandaUkraineUnited Arab EmiratesUnited KingdomUnited StatesUpper middle incomeUruguayUzbekistanVanuatuVenezuela, RBVietnamVirgin Islands (U.S.)West Bank and GazaWorldYemen, Rep.ZambiaZimbabwe Zeitlinie:
Diese Zeitleiste vorliegt die Graphik ab 1962 J. bis 2016 J. Post-demographic dividend. Die Angaben bis 1961 J. sind nicht vorhanden. Die Zahl aktueller Beobachtungen nach Daten: 55.
Die Quelle (Bezeichnung):
Kennzahlen der Weltentwicklung
Die Quelle (Einrichtung):
Food and Agriculture Organization and World Bank population estimates.
Kategorien:
Urban Development
Es wurde aktualisiert:
23 Apr 2017 Jahr
Kennzahlen der Wertänderungen vom Jahr zum Jahr
Minimum:
24.338
1 Jan 1962 Jahr
Maximum:
34.883
1 Jan 2016 Jahr
Zum Datum der Beobachtung
Wert
Absolute Veränderung
Die Veränderung bezüglich dem vorherigen Wert
1 Jan 1962 Jahr
24.338
+24.338
0.0%
1 Jan 1963 Jahr
24.639
+0.301
1.24%
1 Jan 1964 Jahr
24.935
+0.296
1.2%
1 Jan 1965 Jahr
25.225
+0.29
1.16%
1 Jan 1966 Jahr
25.506
+0.281
1.11%
1 Jan 1967 Jahr
25.768
+0.262
1.03%
1 Jan 1968 Jahr
26.012
+0.244
0.95%
1 Jan 1969 Jahr
26.226
+0.214
0.82%
1 Jan 1970 Jahr
26.494
+0.268
1.02%
1 Jan 1971 Jahr
26.733
+0.24
0.9%
1 Jan 1972 Jahr
26.991
+0.258
0.97%
1 Jan 1973 Jahr
27.248
+0.257
0.95%
1 Jan 1974 Jahr
27.473
+0.225
0.83%
1 Jan 1975 Jahr
27.729
+0.256
0.93%
1 Jan 1976 Jahr
27.967
+0.239
0.86%
1 Jan 1977 Jahr
28.154
+0.187
0.67%
1 Jan 1978 Jahr
28.347
+0.192
0.68%
1 Jan 1979 Jahr
28.541
+0.194
0.68%
1 Jan 1980 Jahr
28.742
+0.202
0.71%
1 Jan 1981 Jahr
28.936
+0.193
0.67%
1 Jan 1982 Jahr
29.129
+0.193
0.67%
1 Jan 1983 Jahr
29.304
+0.176
0.6%
1 Jan 1984 Jahr
29.466
+0.162
0.55%
1 Jan 1985 Jahr
29.62
+0.154
0.52%
1 Jan 1986 Jahr
29.773
+0.154
0.52%
1 Jan 1987 Jahr
29.941
+0.167
0.56%
1 Jan 1988 Jahr
30.111
+0.17
0.57%
1 Jan 1989 Jahr
30.288
+0.177
0.59%
1 Jan 1990 Jahr
30.478
+0.19
0.63%
1 Jan 1991 Jahr
30.673
+0.196
0.64%
1 Jan 1992 Jahr
30.874
+0.201
0.65%
1 Jan 1993 Jahr
31.09
+0.217
0.7%
1 Jan 1994 Jahr
31.299
+0.208
0.67%
1 Jan 1995 Jahr
31.48
+0.181
0.58%
1 Jan 1996 Jahr
31.652
+0.172
0.55%
1 Jan 1997 Jahr
31.818
+0.166
0.52%
1 Jan 1998 Jahr
31.983
+0.166
0.52%
1 Jan 1999 Jahr
32.137
+0.153
0.48%
1 Jan 2000 Jahr
32.293
+0.156
0.48%
1 Jan 2001 Jahr
32.415
+0.122
0.38%
1 Jan 2002 Jahr
32.576
+0.161
0.5%
1 Jan 2003 Jahr
32.739
+0.163
0.5%
1 Jan 2004 Jahr
32.903
+0.164
0.5%
1 Jan 2005 Jahr
33.074
+0.171
0.52%
1 Jan 2006 Jahr
33.243
+0.169
0.51%
1 Jan 2007 Jahr
33.422
+0.179
0.54%
1 Jan 2008 Jahr
33.61
+0.188
0.56%
1 Jan 2009 Jahr
33.83
+0.22
0.65%
1 Jan 2010 Jahr
34.004
+0.174
0.51%
1 Jan 2011 Jahr
34.162
+0.158
0.47%
1 Jan 2012 Jahr
34.257
+0.095
0.28%
1 Jan 2013 Jahr
34.408
+0.15
0.44%
1 Jan 2014 Jahr
34.565
+0.158
0.46%
1 Jan 2015 Jahr
34.725
+0.16
0.46%
1 Jan 2016 Jahr
34.883
+0.158
0.45%
Bewertung der Länder gemäß mit laufender Statistik nach Jahren


Kommentare: