29
/de/
de
AIzaSyAYiBZKx7MnpbEhh9jyipgxe19OcubqV5w
April 1, 2024
199650
Mongolia
MNG
true
2
1
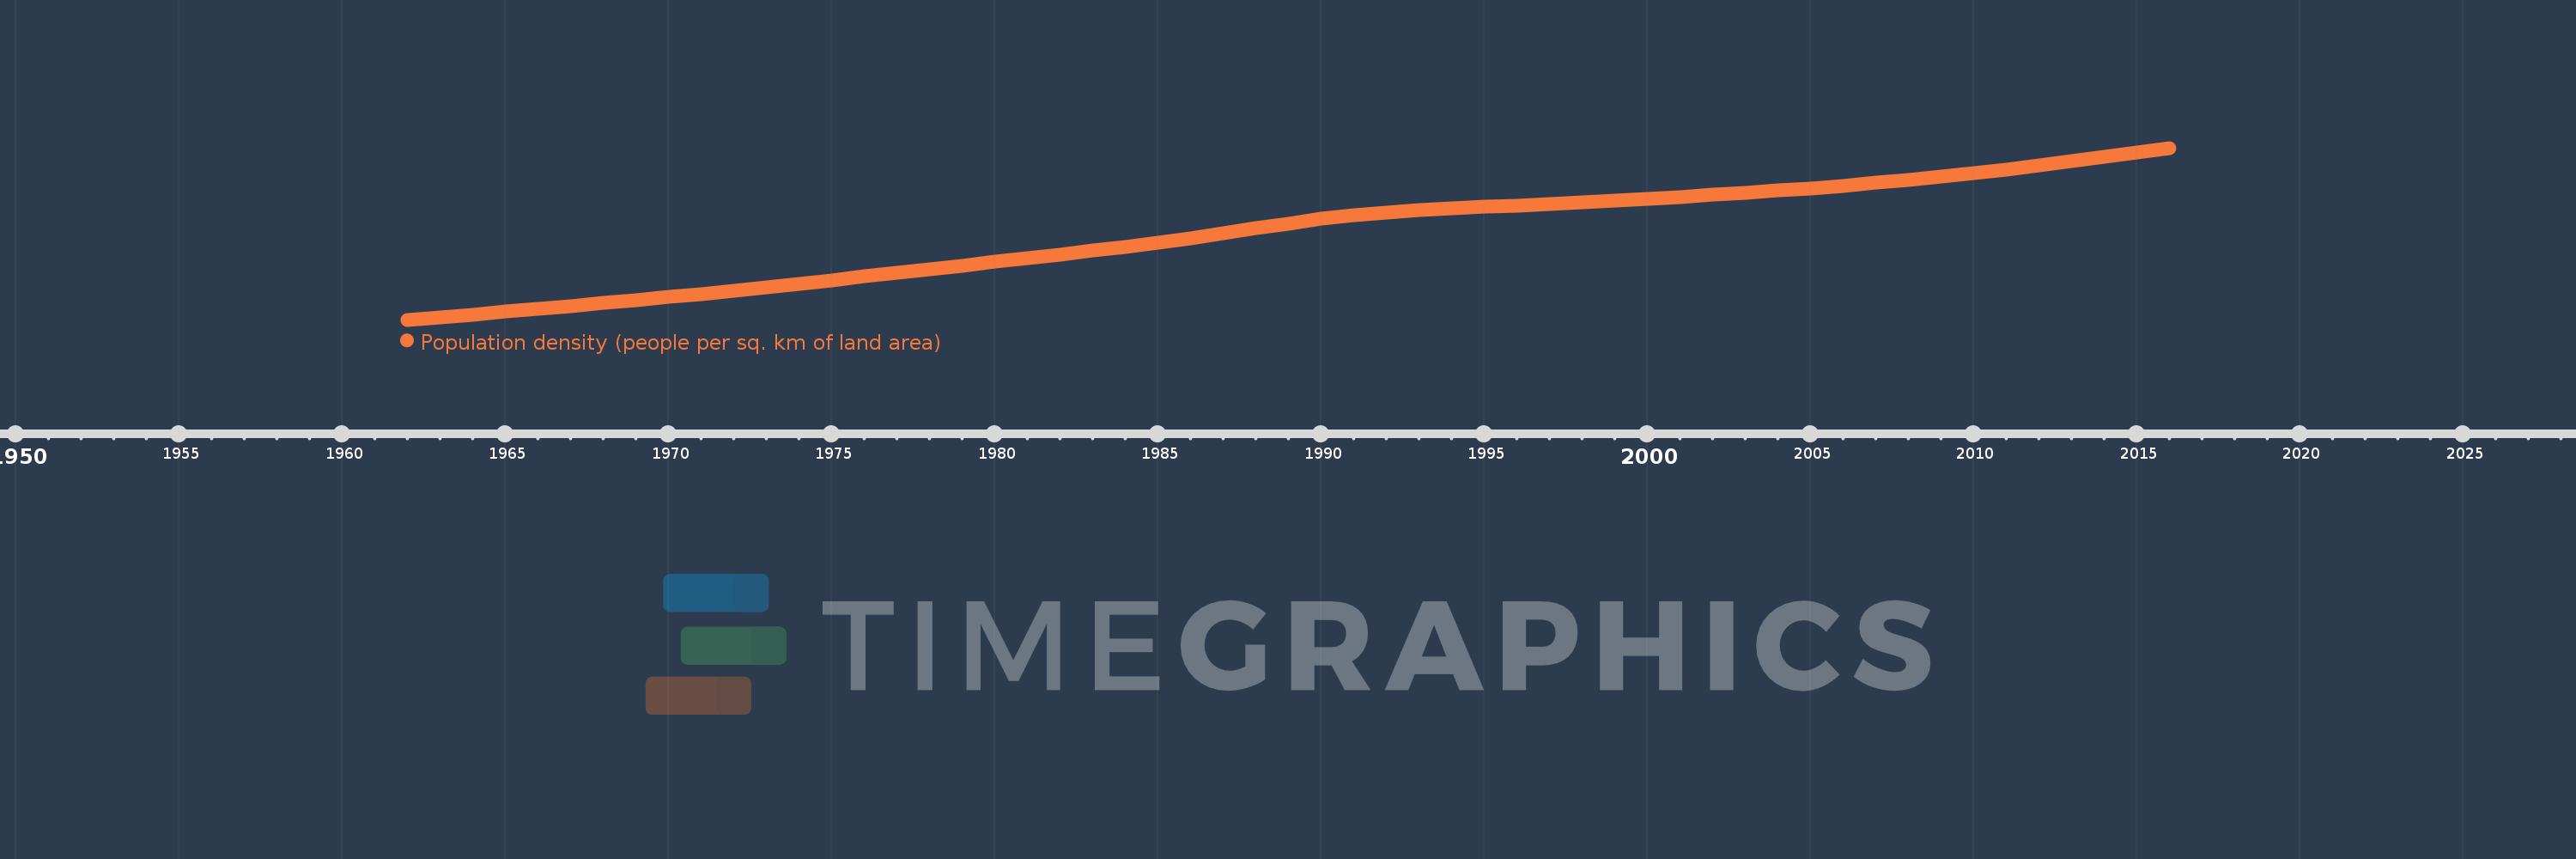
Population density (people per sq. km of land area)
2016,2015,2014,2013,2012,2011,2010,2009,2008,2007,2006,2005,2004,2003,2002,2001,2000,1999,1998,1997,1996,1995,1994,1993,1992,1991,1990,1989,1988,1987,1986,1985,1984,1983,1982,1981,1980,1979,1978,1977,1976,1975,1974,1973,1972,1971,1970,1969,1968,1967,1966,1965,1964,1963,1962
Diese Statistik in anderen Ländern:
AfghanistanAlbaniaAlgeriaAmerican SamoaAndorraAngolaAntigua and BarbudaArab WorldArgentinaArmeniaArubaAustraliaAustriaAzerbaijanBahamas, TheBahrainBangladeshBarbadosBelarusBelgiumBelizeBeninBermudaBhutanBoliviaBosnia and HerzegovinaBotswanaBrazilBritish Virgin IslandsBrunei DarussalamBulgariaBurkina FasoBurundiCabo VerdeCambodiaCameroonCanadaCaribbean small statesCayman IslandsCentral African RepublicCentral Europe and the BalticsChadChannel IslandsChileChinaColombiaComorosCongo, Dem. Rep.Congo, Rep.Costa RicaCote d'IvoireCroatiaCubaCuracaoCyprusCzech RepublicDenmarkDjiboutiDominicaDominican RepublicEarly-demographic dividendEast Asia & PacificEast Asia & Pacific (excluding high income)East Asia & Pacific (IDA & IBRD countries)EcuadorEgypt, Arab Rep.El SalvadorEquatorial GuineaEritreaEstoniaEthiopiaEuro areaEurope & Central AsiaEurope & Central Asia (excluding high income)Europe & Central Asia (IDA & IBRD countries)European UnionFaroe IslandsFijiFinlandFragile and conflict affected situationsFranceFrench PolynesiaGabonGambia, TheGeorgiaGermanyGhanaGibraltarGreeceGreenlandGrenadaGuamGuatemalaGuineaGuinea-BissauGuyanaHaitiHeavily indebted poor countries (HIPC)High incomeHondurasHong Kong SAR, ChinaHungaryIBRD onlyIcelandIDA & IBRD totalIDA blendIDA onlyIDA totalIndiaIndonesiaIran, Islamic Rep.IraqIrelandIsle of ManIsraelItalyJamaicaJapanJordanKazakhstanKenyaKiribatiKorea, Dem. People’s Rep.Korea, Rep.KosovoKuwaitKyrgyz RepublicLao PDRLate-demographic dividendLatin America & Caribbean Latin America & Caribbean (excluding high income)Latin America & the Caribbean (IDA & IBRD countries)LatviaLeast developed countries: UN classificationLebanonLesothoLiberiaLibyaLiechtensteinLithuaniaLow & middle incomeLow incomeLower middle incomeLuxembourgMacao SAR, ChinaMacedonia, FYRMadagascarMalawiMalaysiaMaldivesMaliMaltaMarshall IslandsMauritaniaMauritiusMexicoMicronesia, Fed. Sts.Middle East & North AfricaMiddle East & North Africa (excluding high income)Middle East & North Africa (IDA & IBRD countries)Middle incomeMoldovaMonacoMongoliaMontenegroMoroccoMozambiqueMyanmarNamibiaNauruNepalNetherlandsNew CaledoniaNew ZealandNicaraguaNigerNigeriaNorth AmericaNorthern Mariana IslandsNorwayOECD membersOmanOther small statesPacific island small statesPakistanPalauPanamaPapua New GuineaParaguayPeruPhilippinesPolandPortugalPost-demographic dividendPre-demographic dividendPuerto RicoQatarRomaniaRussian FederationRwandaSamoaSan MarinoSao Tome and PrincipeSaudi ArabiaSenegalSerbiaSeychellesSierra LeoneSingaporeSint Maarten (Dutch part)Slovak RepublicSloveniaSmall statesSolomon IslandsSomaliaSouth AfricaSouth AsiaSouth Asia (IDA & IBRD)SpainSri LankaSt. Kitts and NevisSt. LuciaSt. Martin (French part)St. Vincent and the GrenadinesSub-Saharan Africa Sub-Saharan Africa (excluding high income)Sub-Saharan Africa (IDA & IBRD countries)SudanSurinameSwazilandSwedenSwitzerlandSyrian Arab RepublicTajikistanTanzaniaThailandTimor-LesteTogoTongaTrinidad and TobagoTunisiaTurkeyTurkmenistanTurks and Caicos IslandsTuvaluUgandaUkraineUnited Arab EmiratesUnited KingdomUnited StatesUpper middle incomeUruguayUzbekistanVanuatuVenezuela, RBVietnamVirgin Islands (U.S.)West Bank and GazaWorldYemen, Rep.ZambiaZimbabwe Zeitlinie:
Diese Zeitleiste vorliegt die Graphik ab 1962 J. bis 2016 J. Mongolia. Die Angaben bis 1961 J. sind nicht vorhanden. Die Zahl aktueller Beobachtungen nach Daten: 55.
Die Quelle (Bezeichnung):
Kennzahlen der Weltentwicklung
Die Quelle (Einrichtung):
Food and Agriculture Organization and World Bank population estimates.
Kategorien:
Urban Development
Es wurde aktualisiert:
23 Apr 2017 Jahr
Kennzahlen der Wertänderungen vom Jahr zum Jahr
Minimum:
0.632
1 Jan 1962 Jahr
Maximum:
1.905
1 Jan 2016 Jahr
Zum Datum der Beobachtung
Wert
Absolute Veränderung
Die Veränderung bezüglich dem vorherigen Wert
1 Jan 1962 Jahr
0.632
+0.632
0.0%
1 Jan 1963 Jahr
0.651
+0.019
2.97%
1 Jan 1964 Jahr
0.671
+0.02
3.07%
1 Jan 1965 Jahr
0.692
+0.021
3.08%
1 Jan 1966 Jahr
0.713
+0.021
3.03%
1 Jan 1967 Jahr
0.734
+0.021
2.97%
1 Jan 1968 Jahr
0.755
+0.021
2.91%
1 Jan 1969 Jahr
0.777
+0.022
2.89%
1 Jan 1970 Jahr
0.8
+0.023
2.91%
1 Jan 1971 Jahr
0.823
+0.024
2.95%
1 Jan 1972 Jahr
0.848
+0.025
2.99%
1 Jan 1973 Jahr
0.873
+0.026
3.01%
1 Jan 1974 Jahr
0.899
+0.026
3.0%
1 Jan 1975 Jahr
0.926
+0.026
2.94%
1 Jan 1976 Jahr
0.952
+0.027
2.87%
1 Jan 1977 Jahr
0.979
+0.027
2.79%
1 Jan 1978 Jahr
1.006
+0.027
2.72%
1 Jan 1979 Jahr
1.032
+0.027
2.67%
1 Jan 1980 Jahr
1.06
+0.027
2.64%
1 Jan 1981 Jahr
1.088
+0.028
2.63%
1 Jan 1982 Jahr
1.116
+0.028
2.6%
1 Jan 1983 Jahr
1.144
+0.028
2.55%
1 Jan 1984 Jahr
1.174
+0.029
2.56%
1 Jan 1985 Jahr
1.204
+0.031
2.63%
1 Jan 1986 Jahr
1.237
+0.033
2.71%
1 Jan 1987 Jahr
1.272
+0.035
2.83%
1 Jan 1988 Jahr
1.309
+0.037
2.89%
1 Jan 1989 Jahr
1.345
+0.036
2.77%
1 Jan 1990 Jahr
1.378
+0.033
2.45%
1 Jan 1991 Jahr
1.406
+0.028
2.01%
1 Jan 1992 Jahr
1.428
+0.022
1.55%
1 Jan 1993 Jahr
1.444
+0.016
1.15%
1 Jan 1994 Jahr
1.457
+0.013
0.88%
1 Jan 1995 Jahr
1.468
+0.011
0.76%
1 Jan 1996 Jahr
1.479
+0.011
0.77%
1 Jan 1997 Jahr
1.491
+0.012
0.81%
1 Jan 1998 Jahr
1.503
+0.012
0.83%
1 Jan 1999 Jahr
1.516
+0.013
0.85%
1 Jan 2000 Jahr
1.529
+0.013
0.87%
1 Jan 2001 Jahr
1.543
+0.014
0.9%
1 Jan 2002 Jahr
1.558
+0.014
0.93%
1 Jan 2003 Jahr
1.573
+0.015
0.98%
1 Jan 2004 Jahr
1.589
+0.016
1.05%
1 Jan 2005 Jahr
1.607
+0.018
1.12%
1 Jan 2006 Jahr
1.626
+0.019
1.19%
1 Jan 2007 Jahr
1.647
+0.021
1.27%
1 Jan 2008 Jahr
1.669
+0.022
1.34%
1 Jan 2009 Jahr
1.693
+0.024
1.42%
1 Jan 2010 Jahr
1.718
+0.026
1.52%
1 Jan 2011 Jahr
1.746
+0.028
1.61%
1 Jan 2012 Jahr
1.776
+0.03
1.71%
1 Jan 2013 Jahr
1.808
+0.032
1.79%
1 Jan 2014 Jahr
1.84
+0.033
1.81%
1 Jan 2015 Jahr
1.873
+0.033
1.77%
1 Jan 2016 Jahr
1.905
+0.032
1.69%
Bewertung der Länder gemäß mit laufender Statistik nach Jahren


Kommentare: