29
/de/
de
AIzaSyAYiBZKx7MnpbEhh9jyipgxe19OcubqV5w
April 1, 2024
244030
Solomon Islands
SLB
true
2
1
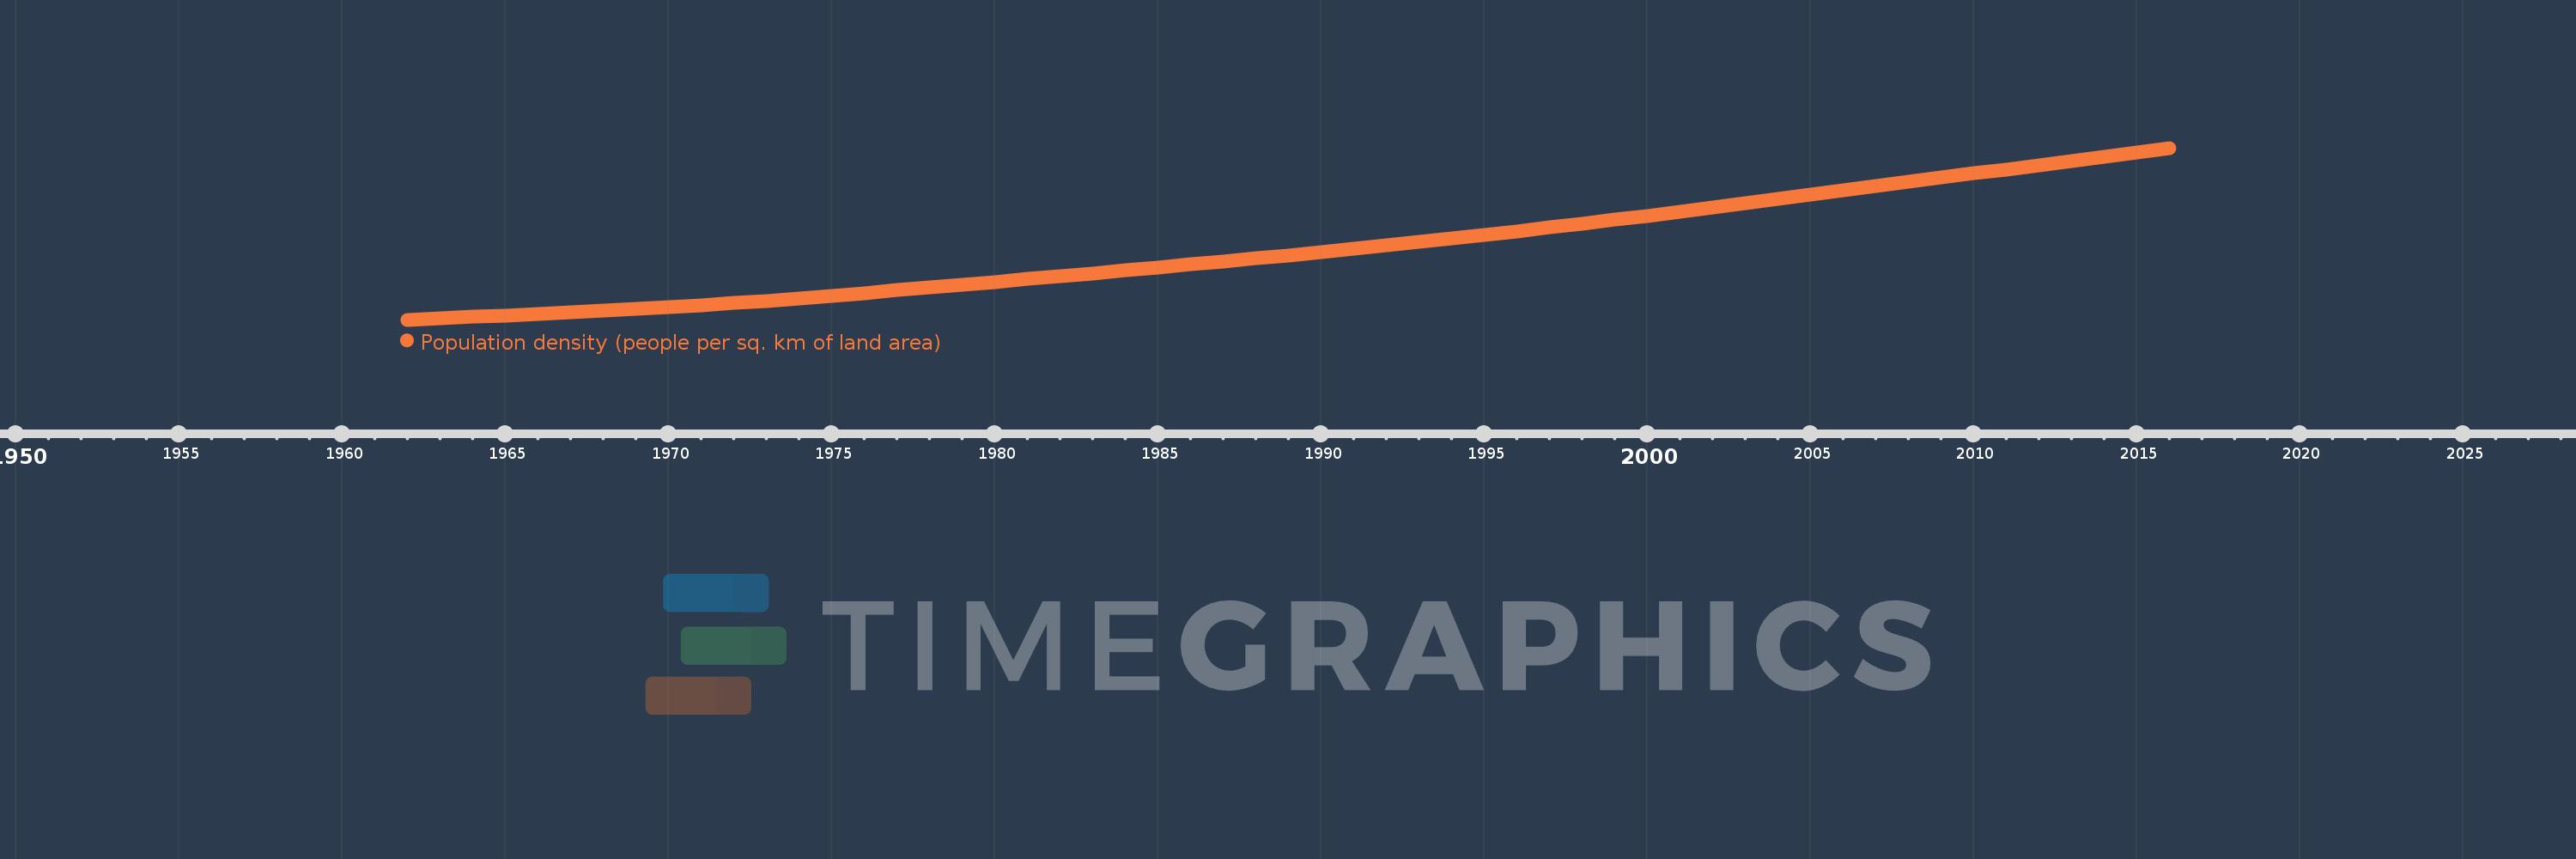
Population density (people per sq. km of land area)
2016,2015,2014,2013,2012,2011,2010,2009,2008,2007,2006,2005,2004,2003,2002,2001,2000,1999,1998,1997,1996,1995,1994,1993,1992,1991,1990,1989,1988,1987,1986,1985,1984,1983,1982,1981,1980,1979,1978,1977,1976,1975,1974,1973,1972,1971,1970,1969,1968,1967,1966,1965,1964,1963,1962
Diese Statistik in anderen Ländern:
AfghanistanAlbaniaAlgeriaAmerican SamoaAndorraAngolaAntigua and BarbudaArab WorldArgentinaArmeniaArubaAustraliaAustriaAzerbaijanBahamas, TheBahrainBangladeshBarbadosBelarusBelgiumBelizeBeninBermudaBhutanBoliviaBosnia and HerzegovinaBotswanaBrazilBritish Virgin IslandsBrunei DarussalamBulgariaBurkina FasoBurundiCabo VerdeCambodiaCameroonCanadaCaribbean small statesCayman IslandsCentral African RepublicCentral Europe and the BalticsChadChannel IslandsChileChinaColombiaComorosCongo, Dem. Rep.Congo, Rep.Costa RicaCote d'IvoireCroatiaCubaCuracaoCyprusCzech RepublicDenmarkDjiboutiDominicaDominican RepublicEarly-demographic dividendEast Asia & PacificEast Asia & Pacific (excluding high income)East Asia & Pacific (IDA & IBRD countries)EcuadorEgypt, Arab Rep.El SalvadorEquatorial GuineaEritreaEstoniaEthiopiaEuro areaEurope & Central AsiaEurope & Central Asia (excluding high income)Europe & Central Asia (IDA & IBRD countries)European UnionFaroe IslandsFijiFinlandFragile and conflict affected situationsFranceFrench PolynesiaGabonGambia, TheGeorgiaGermanyGhanaGibraltarGreeceGreenlandGrenadaGuamGuatemalaGuineaGuinea-BissauGuyanaHaitiHeavily indebted poor countries (HIPC)High incomeHondurasHong Kong SAR, ChinaHungaryIBRD onlyIcelandIDA & IBRD totalIDA blendIDA onlyIDA totalIndiaIndonesiaIran, Islamic Rep.IraqIrelandIsle of ManIsraelItalyJamaicaJapanJordanKazakhstanKenyaKiribatiKorea, Dem. People’s Rep.Korea, Rep.KosovoKuwaitKyrgyz RepublicLao PDRLate-demographic dividendLatin America & Caribbean Latin America & Caribbean (excluding high income)Latin America & the Caribbean (IDA & IBRD countries)LatviaLeast developed countries: UN classificationLebanonLesothoLiberiaLibyaLiechtensteinLithuaniaLow & middle incomeLow incomeLower middle incomeLuxembourgMacao SAR, ChinaMacedonia, FYRMadagascarMalawiMalaysiaMaldivesMaliMaltaMarshall IslandsMauritaniaMauritiusMexicoMicronesia, Fed. Sts.Middle East & North AfricaMiddle East & North Africa (excluding high income)Middle East & North Africa (IDA & IBRD countries)Middle incomeMoldovaMonacoMongoliaMontenegroMoroccoMozambiqueMyanmarNamibiaNauruNepalNetherlandsNew CaledoniaNew ZealandNicaraguaNigerNigeriaNorth AmericaNorthern Mariana IslandsNorwayOECD membersOmanOther small statesPacific island small statesPakistanPalauPanamaPapua New GuineaParaguayPeruPhilippinesPolandPortugalPost-demographic dividendPre-demographic dividendPuerto RicoQatarRomaniaRussian FederationRwandaSamoaSan MarinoSao Tome and PrincipeSaudi ArabiaSenegalSerbiaSeychellesSierra LeoneSingaporeSint Maarten (Dutch part)Slovak RepublicSloveniaSmall statesSolomon IslandsSomaliaSouth AfricaSouth AsiaSouth Asia (IDA & IBRD)SpainSri LankaSt. Kitts and NevisSt. LuciaSt. Martin (French part)St. Vincent and the GrenadinesSub-Saharan Africa Sub-Saharan Africa (excluding high income)Sub-Saharan Africa (IDA & IBRD countries)SudanSurinameSwazilandSwedenSwitzerlandSyrian Arab RepublicTajikistanTanzaniaThailandTimor-LesteTogoTongaTrinidad and TobagoTunisiaTurkeyTurkmenistanTurks and Caicos IslandsTuvaluUgandaUkraineUnited Arab EmiratesUnited KingdomUnited StatesUpper middle incomeUruguayUzbekistanVanuatuVenezuela, RBVietnamVirgin Islands (U.S.)West Bank and GazaWorldYemen, Rep.ZambiaZimbabwe Zeitlinie:
Diese Zeitleiste vorliegt die Graphik ab 1962 J. bis 2016 J. Solomon Islands. Die Angaben bis 1961 J. sind nicht vorhanden. Die Zahl aktueller Beobachtungen nach Daten: 55.
Die Quelle (Bezeichnung):
Kennzahlen der Weltentwicklung
Die Quelle (Einrichtung):
Food and Agriculture Organization and World Bank population estimates.
Kategorien:
Urban Development
Es wurde aktualisiert:
23 Apr 2017 Jahr
Kennzahlen der Wertänderungen vom Jahr zum Jahr
Minimum:
4.337
1 Jan 1962 Jahr
Maximum:
20.85
1 Jan 2016 Jahr
Zum Datum der Beobachtung
Wert
Absolute Veränderung
Die Veränderung bezüglich dem vorherigen Wert
1 Jan 1962 Jahr
4.337
+4.337
0.0%
1 Jan 1963 Jahr
4.468
+0.131
3.02%
1 Jan 1964 Jahr
4.604
+0.136
3.03%
1 Jan 1965 Jahr
4.744
+0.14
3.05%
1 Jan 1966 Jahr
4.889
+0.145
3.06%
1 Jan 1967 Jahr
5.038
+0.149
3.05%
1 Jan 1968 Jahr
5.193
+0.155
3.07%
1 Jan 1969 Jahr
5.356
+0.163
3.15%
1 Jan 1970 Jahr
5.533
+0.177
3.3%
1 Jan 1971 Jahr
5.727
+0.193
3.5%
1 Jan 1972 Jahr
5.938
+0.212
3.69%
1 Jan 1973 Jahr
6.166
+0.228
3.84%
1 Jan 1974 Jahr
6.408
+0.241
3.91%
1 Jan 1975 Jahr
6.657
+0.25
3.89%
1 Jan 1976 Jahr
6.911
+0.254
3.82%
1 Jan 1977 Jahr
7.168
+0.257
3.72%
1 Jan 1978 Jahr
7.429
+0.261
3.64%
1 Jan 1979 Jahr
7.694
+0.265
3.56%
1 Jan 1980 Jahr
7.964
+0.27
3.51%
1 Jan 1981 Jahr
8.239
+0.275
3.46%
1 Jan 1982 Jahr
8.52
+0.281
3.41%
1 Jan 1983 Jahr
8.807
+0.286
3.36%
1 Jan 1984 Jahr
9.096
+0.289
3.29%
1 Jan 1985 Jahr
9.386
+0.29
3.19%
1 Jan 1986 Jahr
9.675
+0.289
3.08%
1 Jan 1987 Jahr
9.962
+0.287
2.97%
1 Jan 1988 Jahr
10.249
+0.287
2.88%
1 Jan 1989 Jahr
10.538
+0.289
2.82%
1 Jan 1990 Jahr
10.835
+0.296
2.81%
1 Jan 1991 Jahr
11.141
+0.307
2.83%
1 Jan 1992 Jahr
11.46
+0.319
2.86%
1 Jan 1993 Jahr
11.789
+0.329
2.87%
1 Jan 1994 Jahr
12.129
+0.34
2.88%
1 Jan 1995 Jahr
12.478
+0.349
2.87%
1 Jan 1996 Jahr
12.834
+0.357
2.86%
1 Jan 1997 Jahr
13.199
+0.364
2.84%
1 Jan 1998 Jahr
13.571
+0.372
2.82%
1 Jan 1999 Jahr
13.951
+0.38
2.8%
1 Jan 2000 Jahr
14.338
+0.387
2.77%
1 Jan 2001 Jahr
14.732
+0.394
2.75%
1 Jan 2002 Jahr
15.132
+0.4
2.72%
1 Jan 2003 Jahr
15.537
+0.406
2.68%
1 Jan 2004 Jahr
15.947
+0.409
2.63%
1 Jan 2005 Jahr
16.357
+0.41
2.57%
1 Jan 2006 Jahr
16.767
+0.41
2.5%
1 Jan 2007 Jahr
17.175
+0.408
2.43%
1 Jan 2008 Jahr
17.58
+0.406
2.36%
1 Jan 2009 Jahr
17.985
+0.405
2.3%
1 Jan 2010 Jahr
18.391
+0.406
2.26%
1 Jan 2011 Jahr
18.799
+0.408
2.22%
1 Jan 2012 Jahr
19.209
+0.41
2.18%
1 Jan 2013 Jahr
19.62
+0.411
2.14%
1 Jan 2014 Jahr
20.032
+0.412
2.1%
1 Jan 2015 Jahr
20.442
+0.41
2.05%
1 Jan 2016 Jahr
20.85
+0.408
2.0%
Bewertung der Länder gemäß mit laufender Statistik nach Jahren


Kommentare: