29
/de/
de
AIzaSyAYiBZKx7MnpbEhh9jyipgxe19OcubqV5w
April 1, 2024
262768
Thailand
THA
true
2
1
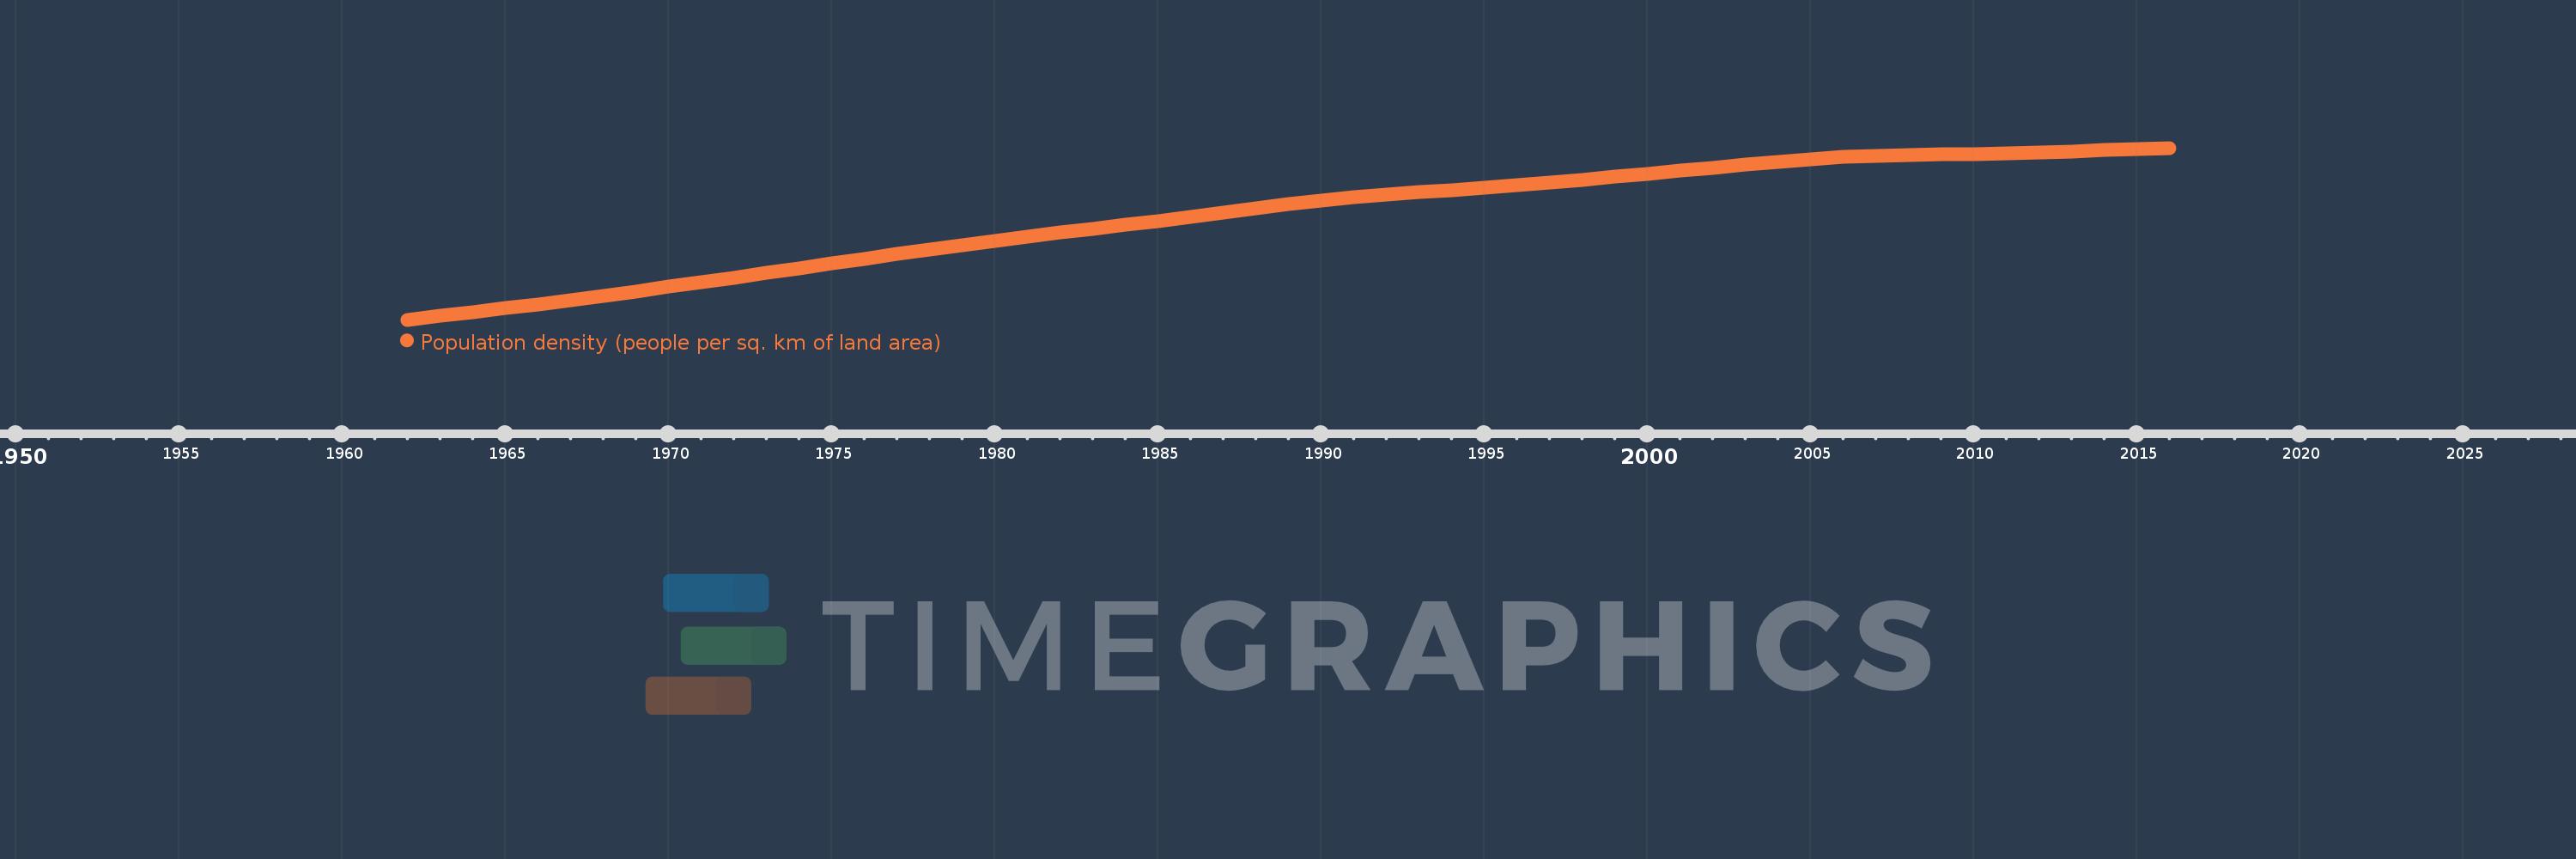
Population density (people per sq. km of land area)
2016,2015,2014,2013,2012,2011,2010,2009,2008,2007,2006,2005,2004,2003,2002,2001,2000,1999,1998,1997,1996,1995,1994,1993,1992,1991,1990,1989,1988,1987,1986,1985,1984,1983,1982,1981,1980,1979,1978,1977,1976,1975,1974,1973,1972,1971,1970,1969,1968,1967,1966,1965,1964,1963,1962
Diese Statistik in anderen Ländern:
AfghanistanAlbaniaAlgeriaAmerican SamoaAndorraAngolaAntigua and BarbudaArab WorldArgentinaArmeniaArubaAustraliaAustriaAzerbaijanBahamas, TheBahrainBangladeshBarbadosBelarusBelgiumBelizeBeninBermudaBhutanBoliviaBosnia and HerzegovinaBotswanaBrazilBritish Virgin IslandsBrunei DarussalamBulgariaBurkina FasoBurundiCabo VerdeCambodiaCameroonCanadaCaribbean small statesCayman IslandsCentral African RepublicCentral Europe and the BalticsChadChannel IslandsChileChinaColombiaComorosCongo, Dem. Rep.Congo, Rep.Costa RicaCote d'IvoireCroatiaCubaCuracaoCyprusCzech RepublicDenmarkDjiboutiDominicaDominican RepublicEarly-demographic dividendEast Asia & PacificEast Asia & Pacific (excluding high income)East Asia & Pacific (IDA & IBRD countries)EcuadorEgypt, Arab Rep.El SalvadorEquatorial GuineaEritreaEstoniaEthiopiaEuro areaEurope & Central AsiaEurope & Central Asia (excluding high income)Europe & Central Asia (IDA & IBRD countries)European UnionFaroe IslandsFijiFinlandFragile and conflict affected situationsFranceFrench PolynesiaGabonGambia, TheGeorgiaGermanyGhanaGibraltarGreeceGreenlandGrenadaGuamGuatemalaGuineaGuinea-BissauGuyanaHaitiHeavily indebted poor countries (HIPC)High incomeHondurasHong Kong SAR, ChinaHungaryIBRD onlyIcelandIDA & IBRD totalIDA blendIDA onlyIDA totalIndiaIndonesiaIran, Islamic Rep.IraqIrelandIsle of ManIsraelItalyJamaicaJapanJordanKazakhstanKenyaKiribatiKorea, Dem. People’s Rep.Korea, Rep.KosovoKuwaitKyrgyz RepublicLao PDRLate-demographic dividendLatin America & Caribbean Latin America & Caribbean (excluding high income)Latin America & the Caribbean (IDA & IBRD countries)LatviaLeast developed countries: UN classificationLebanonLesothoLiberiaLibyaLiechtensteinLithuaniaLow & middle incomeLow incomeLower middle incomeLuxembourgMacao SAR, ChinaMacedonia, FYRMadagascarMalawiMalaysiaMaldivesMaliMaltaMarshall IslandsMauritaniaMauritiusMexicoMicronesia, Fed. Sts.Middle East & North AfricaMiddle East & North Africa (excluding high income)Middle East & North Africa (IDA & IBRD countries)Middle incomeMoldovaMonacoMongoliaMontenegroMoroccoMozambiqueMyanmarNamibiaNauruNepalNetherlandsNew CaledoniaNew ZealandNicaraguaNigerNigeriaNorth AmericaNorthern Mariana IslandsNorwayOECD membersOmanOther small statesPacific island small statesPakistanPalauPanamaPapua New GuineaParaguayPeruPhilippinesPolandPortugalPost-demographic dividendPre-demographic dividendPuerto RicoQatarRomaniaRussian FederationRwandaSamoaSan MarinoSao Tome and PrincipeSaudi ArabiaSenegalSerbiaSeychellesSierra LeoneSingaporeSint Maarten (Dutch part)Slovak RepublicSloveniaSmall statesSolomon IslandsSomaliaSouth AfricaSouth AsiaSouth Asia (IDA & IBRD)SpainSri LankaSt. Kitts and NevisSt. LuciaSt. Martin (French part)St. Vincent and the GrenadinesSub-Saharan Africa Sub-Saharan Africa (excluding high income)Sub-Saharan Africa (IDA & IBRD countries)SudanSurinameSwazilandSwedenSwitzerlandSyrian Arab RepublicTajikistanTanzaniaThailandTimor-LesteTogoTongaTrinidad and TobagoTunisiaTurkeyTurkmenistanTurks and Caicos IslandsTuvaluUgandaUkraineUnited Arab EmiratesUnited KingdomUnited StatesUpper middle incomeUruguayUzbekistanVanuatuVenezuela, RBVietnamVirgin Islands (U.S.)West Bank and GazaWorldYemen, Rep.ZambiaZimbabwe Zeitlinie:
Diese Zeitleiste vorliegt die Graphik ab 1962 J. bis 2016 J. Thailand. Die Angaben bis 1961 J. sind nicht vorhanden. Die Zahl aktueller Beobachtungen nach Daten: 55.
Die Quelle (Bezeichnung):
Kennzahlen der Weltentwicklung
Die Quelle (Einrichtung):
Food and Agriculture Organization and World Bank population estimates.
Kategorien:
Urban Development
Es wurde aktualisiert:
23 Apr 2017 Jahr
Kennzahlen der Wertänderungen vom Jahr zum Jahr
Minimum:
55.245
1 Jan 1962 Jahr
Maximum:
133.022
1 Jan 2016 Jahr
Zum Datum der Beobachtung
Wert
Absolute Veränderung
Die Veränderung bezüglich dem vorherigen Wert
1 Jan 1962 Jahr
55.245
+55.245
0.0%
1 Jan 1963 Jahr
56.922
+1.677
3.04%
1 Jan 1964 Jahr
58.657
+1.734
3.05%
1 Jan 1965 Jahr
60.446
+1.79
3.05%
1 Jan 1966 Jahr
62.289
+1.843
3.05%
1 Jan 1967 Jahr
64.18
+1.891
3.04%
1 Jan 1968 Jahr
66.117
+1.937
3.02%
1 Jan 1969 Jahr
68.099
+1.982
3.0%
1 Jan 1970 Jahr
70.126
+2.028
2.98%
1 Jan 1971 Jahr
72.197
+2.071
2.95%
1 Jan 1972 Jahr
74.311
+2.114
2.93%
1 Jan 1973 Jahr
76.459
+2.147
2.89%
1 Jan 1974 Jahr
78.618
+2.159
2.82%
1 Jan 1975 Jahr
80.76
+2.142
2.73%
1 Jan 1976 Jahr
82.865
+2.105
2.61%
1 Jan 1977 Jahr
84.924
+2.059
2.48%
1 Jan 1978 Jahr
86.938
+2.014
2.37%
1 Jan 1979 Jahr
88.91
+1.972
2.27%
1 Jan 1980 Jahr
90.846
+1.936
2.18%
1 Jan 1981 Jahr
92.751
+1.905
2.1%
1 Jan 1982 Jahr
94.613
+1.863
2.01%
1 Jan 1983 Jahr
96.431
+1.818
1.92%
1 Jan 1984 Jahr
98.227
+1.796
1.86%
1 Jan 1985 Jahr
100.032
+1.805
1.84%
1 Jan 1986 Jahr
101.864
+1.832
1.83%
1 Jan 1987 Jahr
103.746
+1.882
1.85%
1 Jan 1988 Jahr
105.658
+1.912
1.84%
1 Jan 1989 Jahr
107.525
+1.867
1.77%
1 Jan 1990 Jahr
109.246
+1.721
1.6%
1 Jan 1991 Jahr
110.753
+1.507
1.38%
1 Jan 1992 Jahr
112.012
+1.259
1.14%
1 Jan 1993 Jahr
113.061
+1.048
0.94%
1 Jan 1994 Jahr
113.993
+0.932
0.82%
1 Jan 1995 Jahr
114.942
+0.95
0.83%
1 Jan 1996 Jahr
116.006
+1.063
0.93%
1 Jan 1997 Jahr
117.205
+1.2
1.03%
1 Jan 1998 Jahr
118.509
+1.304
1.11%
1 Jan 1999 Jahr
119.891
+1.382
1.17%
1 Jan 2000 Jahr
121.306
+1.415
1.18%
1 Jan 2001 Jahr
122.714
+1.408
1.16%
1 Jan 2002 Jahr
124.127
+1.413
1.15%
1 Jan 2003 Jahr
125.539
+1.412
1.14%
1 Jan 2004 Jahr
126.871
+1.332
1.06%
1 Jan 2005 Jahr
128.021
+1.149
0.91%
1 Jan 2006 Jahr
128.92
+0.899
0.7%
1 Jan 2007 Jahr
129.528
+0.608
0.47%
1 Jan 2008 Jahr
129.878
+0.351
0.27%
1 Jan 2009 Jahr
130.074
+0.195
0.15%
1 Jan 2010 Jahr
130.259
+0.186
0.14%
1 Jan 2011 Jahr
130.541
+0.282
0.22%
1 Jan 2012 Jahr
130.954
+0.413
0.32%
1 Jan 2013 Jahr
131.465
+0.511
0.39%
1 Jan 2014 Jahr
132.027
+0.562
0.43%
1 Jan 2015 Jahr
132.565
+0.537
0.41%
1 Jan 2016 Jahr
133.022
+0.457
0.34%
Bewertung der Länder gemäß mit laufender Statistik nach Jahren


Kommentare: