29
/de/
de
AIzaSyAYiBZKx7MnpbEhh9jyipgxe19OcubqV5w
April 1, 2024
266164
Tonga
TON
true
2
1
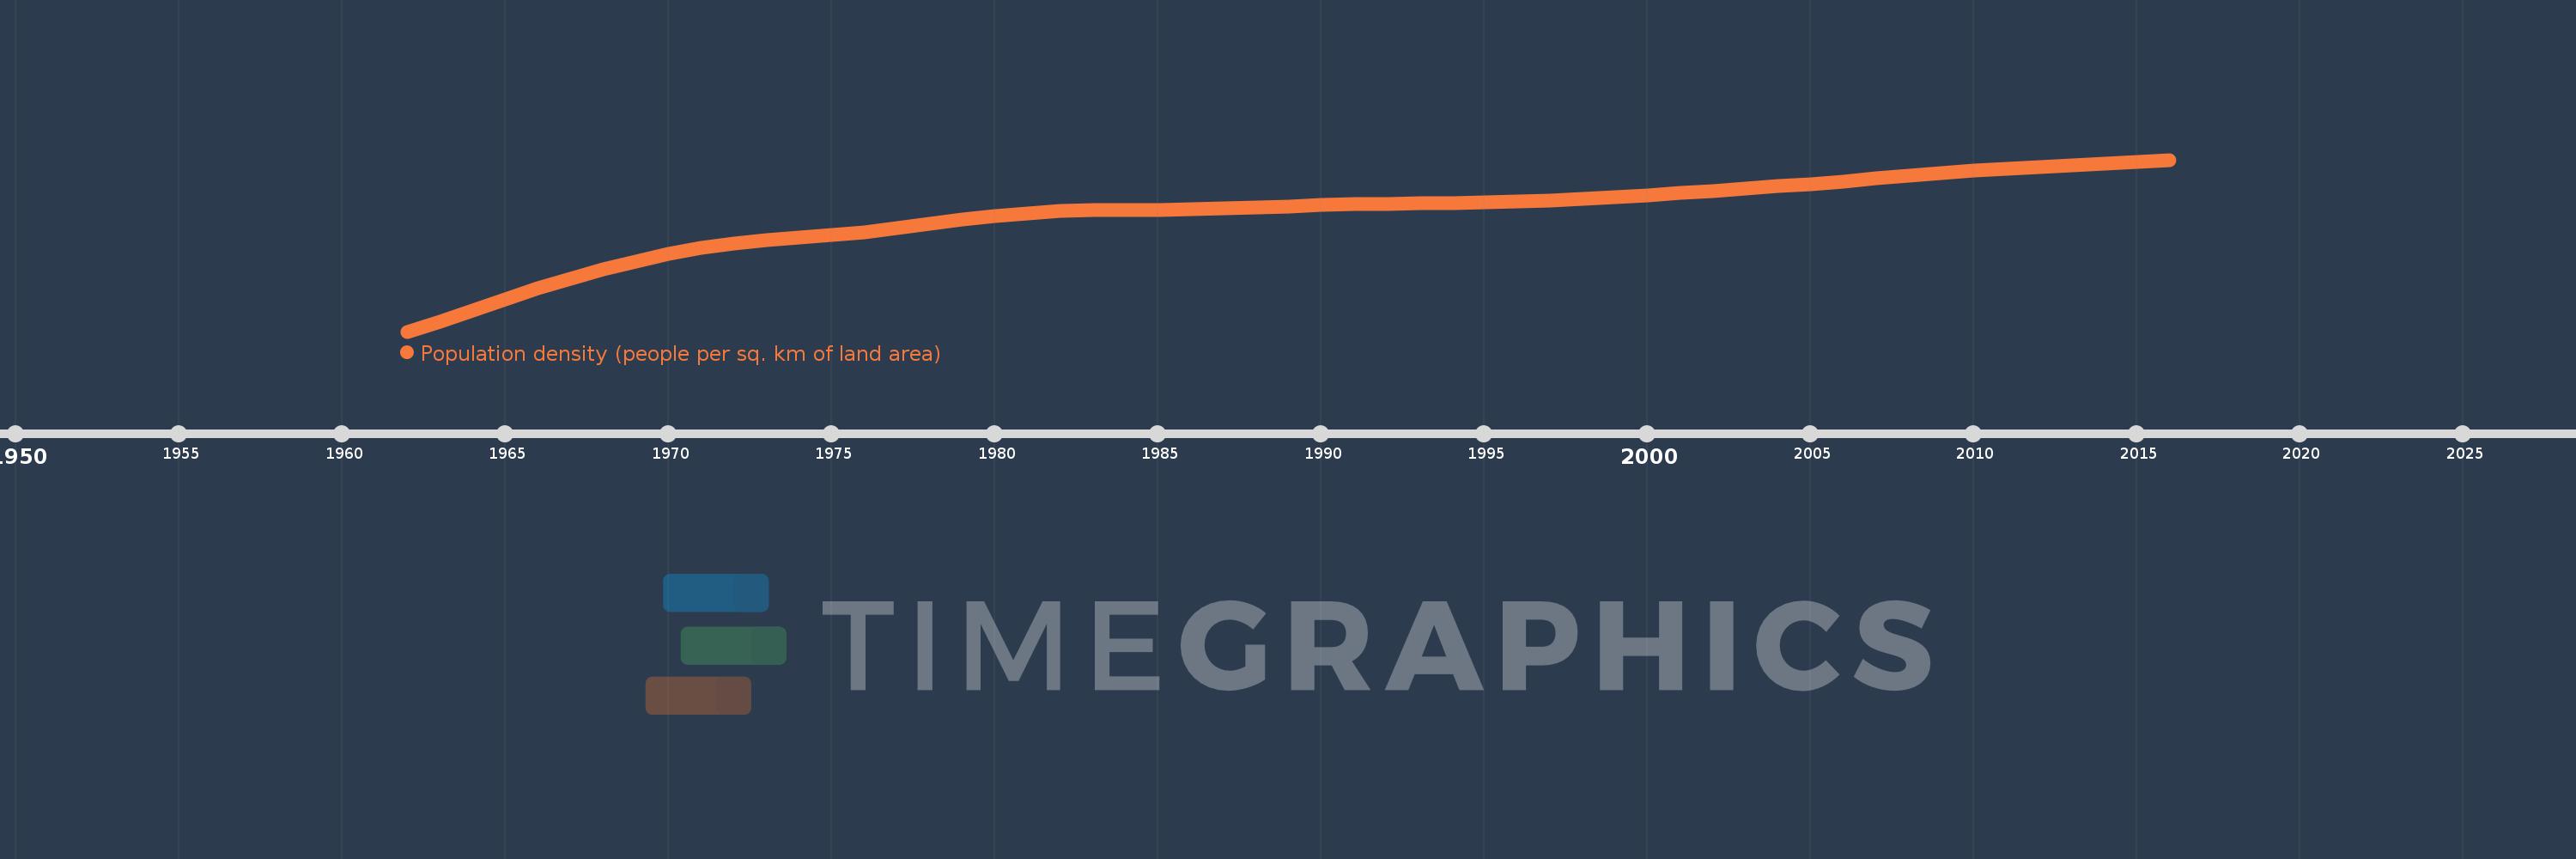
Population density (people per sq. km of land area)
2016,2015,2014,2013,2012,2011,2010,2009,2008,2007,2006,2005,2004,2003,2002,2001,2000,1999,1998,1997,1996,1995,1994,1993,1992,1991,1990,1989,1988,1987,1986,1985,1984,1983,1982,1981,1980,1979,1978,1977,1976,1975,1974,1973,1972,1971,1970,1969,1968,1967,1966,1965,1964,1963,1962
Diese Statistik in anderen Ländern:
AfghanistanAlbaniaAlgeriaAmerican SamoaAndorraAngolaAntigua and BarbudaArab WorldArgentinaArmeniaArubaAustraliaAustriaAzerbaijanBahamas, TheBahrainBangladeshBarbadosBelarusBelgiumBelizeBeninBermudaBhutanBoliviaBosnia and HerzegovinaBotswanaBrazilBritish Virgin IslandsBrunei DarussalamBulgariaBurkina FasoBurundiCabo VerdeCambodiaCameroonCanadaCaribbean small statesCayman IslandsCentral African RepublicCentral Europe and the BalticsChadChannel IslandsChileChinaColombiaComorosCongo, Dem. Rep.Congo, Rep.Costa RicaCote d'IvoireCroatiaCubaCuracaoCyprusCzech RepublicDenmarkDjiboutiDominicaDominican RepublicEarly-demographic dividendEast Asia & PacificEast Asia & Pacific (excluding high income)East Asia & Pacific (IDA & IBRD countries)EcuadorEgypt, Arab Rep.El SalvadorEquatorial GuineaEritreaEstoniaEthiopiaEuro areaEurope & Central AsiaEurope & Central Asia (excluding high income)Europe & Central Asia (IDA & IBRD countries)European UnionFaroe IslandsFijiFinlandFragile and conflict affected situationsFranceFrench PolynesiaGabonGambia, TheGeorgiaGermanyGhanaGibraltarGreeceGreenlandGrenadaGuamGuatemalaGuineaGuinea-BissauGuyanaHaitiHeavily indebted poor countries (HIPC)High incomeHondurasHong Kong SAR, ChinaHungaryIBRD onlyIcelandIDA & IBRD totalIDA blendIDA onlyIDA totalIndiaIndonesiaIran, Islamic Rep.IraqIrelandIsle of ManIsraelItalyJamaicaJapanJordanKazakhstanKenyaKiribatiKorea, Dem. People’s Rep.Korea, Rep.KosovoKuwaitKyrgyz RepublicLao PDRLate-demographic dividendLatin America & Caribbean Latin America & Caribbean (excluding high income)Latin America & the Caribbean (IDA & IBRD countries)LatviaLeast developed countries: UN classificationLebanonLesothoLiberiaLibyaLiechtensteinLithuaniaLow & middle incomeLow incomeLower middle incomeLuxembourgMacao SAR, ChinaMacedonia, FYRMadagascarMalawiMalaysiaMaldivesMaliMaltaMarshall IslandsMauritaniaMauritiusMexicoMicronesia, Fed. Sts.Middle East & North AfricaMiddle East & North Africa (excluding high income)Middle East & North Africa (IDA & IBRD countries)Middle incomeMoldovaMonacoMongoliaMontenegroMoroccoMozambiqueMyanmarNamibiaNauruNepalNetherlandsNew CaledoniaNew ZealandNicaraguaNigerNigeriaNorth AmericaNorthern Mariana IslandsNorwayOECD membersOmanOther small statesPacific island small statesPakistanPalauPanamaPapua New GuineaParaguayPeruPhilippinesPolandPortugalPost-demographic dividendPre-demographic dividendPuerto RicoQatarRomaniaRussian FederationRwandaSamoaSan MarinoSao Tome and PrincipeSaudi ArabiaSenegalSerbiaSeychellesSierra LeoneSingaporeSint Maarten (Dutch part)Slovak RepublicSloveniaSmall statesSolomon IslandsSomaliaSouth AfricaSouth AsiaSouth Asia (IDA & IBRD)SpainSri LankaSt. Kitts and NevisSt. LuciaSt. Martin (French part)St. Vincent and the GrenadinesSub-Saharan Africa Sub-Saharan Africa (excluding high income)Sub-Saharan Africa (IDA & IBRD countries)SudanSurinameSwazilandSwedenSwitzerlandSyrian Arab RepublicTajikistanTanzaniaThailandTimor-LesteTogoTongaTrinidad and TobagoTunisiaTurkeyTurkmenistanTurks and Caicos IslandsTuvaluUgandaUkraineUnited Arab EmiratesUnited KingdomUnited StatesUpper middle incomeUruguayUzbekistanVanuatuVenezuela, RBVietnamVirgin Islands (U.S.)West Bank and GazaWorldYemen, Rep.ZambiaZimbabwe Zeitlinie:
Diese Zeitleiste vorliegt die Graphik ab 1962 J. bis 2016 J. Tonga. Die Angaben bis 1961 J. sind nicht vorhanden. Die Zahl aktueller Beobachtungen nach Daten: 55.
Die Quelle (Bezeichnung):
Kennzahlen der Weltentwicklung
Die Quelle (Einrichtung):
Food and Agriculture Organization and World Bank population estimates.
Kategorien:
Urban Development
Es wurde aktualisiert:
23 Apr 2017 Jahr
Kennzahlen der Wertänderungen vom Jahr zum Jahr
Minimum:
88.528
1 Jan 1962 Jahr
Maximum:
147.458
1 Jan 2016 Jahr
Zum Datum der Beobachtung
Wert
Absolute Veränderung
Die Veränderung bezüglich dem vorherigen Wert
1 Jan 1962 Jahr
88.528
+88.528
0.0%
1 Jan 1963 Jahr
92.021
+3.493
3.95%
1 Jan 1964 Jahr
95.833
+3.813
4.14%
1 Jan 1965 Jahr
99.662
+3.829
4.0%
1 Jan 1966 Jahr
103.282
+3.619
3.63%
1 Jan 1967 Jahr
106.649
+3.367
3.26%
1 Jan 1968 Jahr
109.789
+3.14
2.94%
1 Jan 1969 Jahr
112.633
+2.844
2.59%
1 Jan 1970 Jahr
115.11
+2.476
2.2%
1 Jan 1971 Jahr
117.181
+2.071
1.8%
1 Jan 1972 Jahr
118.778
+1.597
1.36%
1 Jan 1973 Jahr
119.929
+1.151
0.97%
1 Jan 1974 Jahr
120.813
+0.883
0.74%
1 Jan 1975 Jahr
121.679
+0.867
0.72%
1 Jan 1976 Jahr
122.704
+1.025
0.84%
1 Jan 1977 Jahr
123.969
+1.265
1.03%
1 Jan 1978 Jahr
125.411
+1.442
1.16%
1 Jan 1979 Jahr
126.889
+1.478
1.18%
1 Jan 1980 Jahr
128.193
+1.304
1.03%
1 Jan 1981 Jahr
129.176
+0.983
0.77%
1 Jan 1982 Jahr
129.794
+0.618
0.48%
1 Jan 1983 Jahr
130.115
+0.321
0.25%
1 Jan 1984 Jahr
130.243
+0.128
0.1%
1 Jan 1985 Jahr
130.331
+0.088
0.07%
1 Jan 1986 Jahr
130.49
+0.16
0.12%
1 Jan 1987 Jahr
130.76
+0.269
0.21%
1 Jan 1988 Jahr
131.11
+0.35
0.27%
1 Jan 1989 Jahr
131.5
+0.39
0.3%
1 Jan 1990 Jahr
131.865
+0.365
0.28%
1 Jan 1991 Jahr
132.156
+0.29
0.22%
1 Jan 1992 Jahr
132.367
+0.211
0.16%
1 Jan 1993 Jahr
132.529
+0.163
0.12%
1 Jan 1994 Jahr
132.683
+0.154
0.12%
1 Jan 1995 Jahr
132.886
+0.203
0.15%
1 Jan 1996 Jahr
133.179
+0.293
0.22%
1 Jan 1997 Jahr
133.575
+0.396
0.3%
1 Jan 1998 Jahr
134.064
+0.489
0.37%
1 Jan 1999 Jahr
134.635
+0.571
0.43%
1 Jan 2000 Jahr
135.275
+0.64
0.48%
1 Jan 2001 Jahr
135.969
+0.694
0.51%
1 Jan 2002 Jahr
136.714
+0.744
0.55%
1 Jan 2003 Jahr
137.507
+0.793
0.58%
1 Jan 2004 Jahr
138.342
+0.835
0.61%
1 Jan 2005 Jahr
139.203
+0.861
0.62%
1 Jan 2006 Jahr
140.081
+0.878
0.63%
1 Jan 2007 Jahr
140.982
+0.901
0.64%
1 Jan 2008 Jahr
141.901
+0.919
0.65%
1 Jan 2009 Jahr
142.8
+0.899
0.63%
1 Jan 2010 Jahr
143.633
+0.833
0.58%
1 Jan 2011 Jahr
144.371
+0.737
0.51%
1 Jan 2012 Jahr
144.989
+0.618
0.43%
1 Jan 2013 Jahr
145.512
+0.524
0.36%
1 Jan 2014 Jahr
146.026
+0.514
0.35%
1 Jan 2015 Jahr
146.647
+0.621
0.43%
1 Jan 2016 Jahr
147.458
+0.811
0.55%
Bewertung der Länder gemäß mit laufender Statistik nach Jahren


Kommentare: