29
/de/
de
AIzaSyAYiBZKx7MnpbEhh9jyipgxe19OcubqV5w
April 1, 2024
230241
Russian Federation
RUS
true
2
1
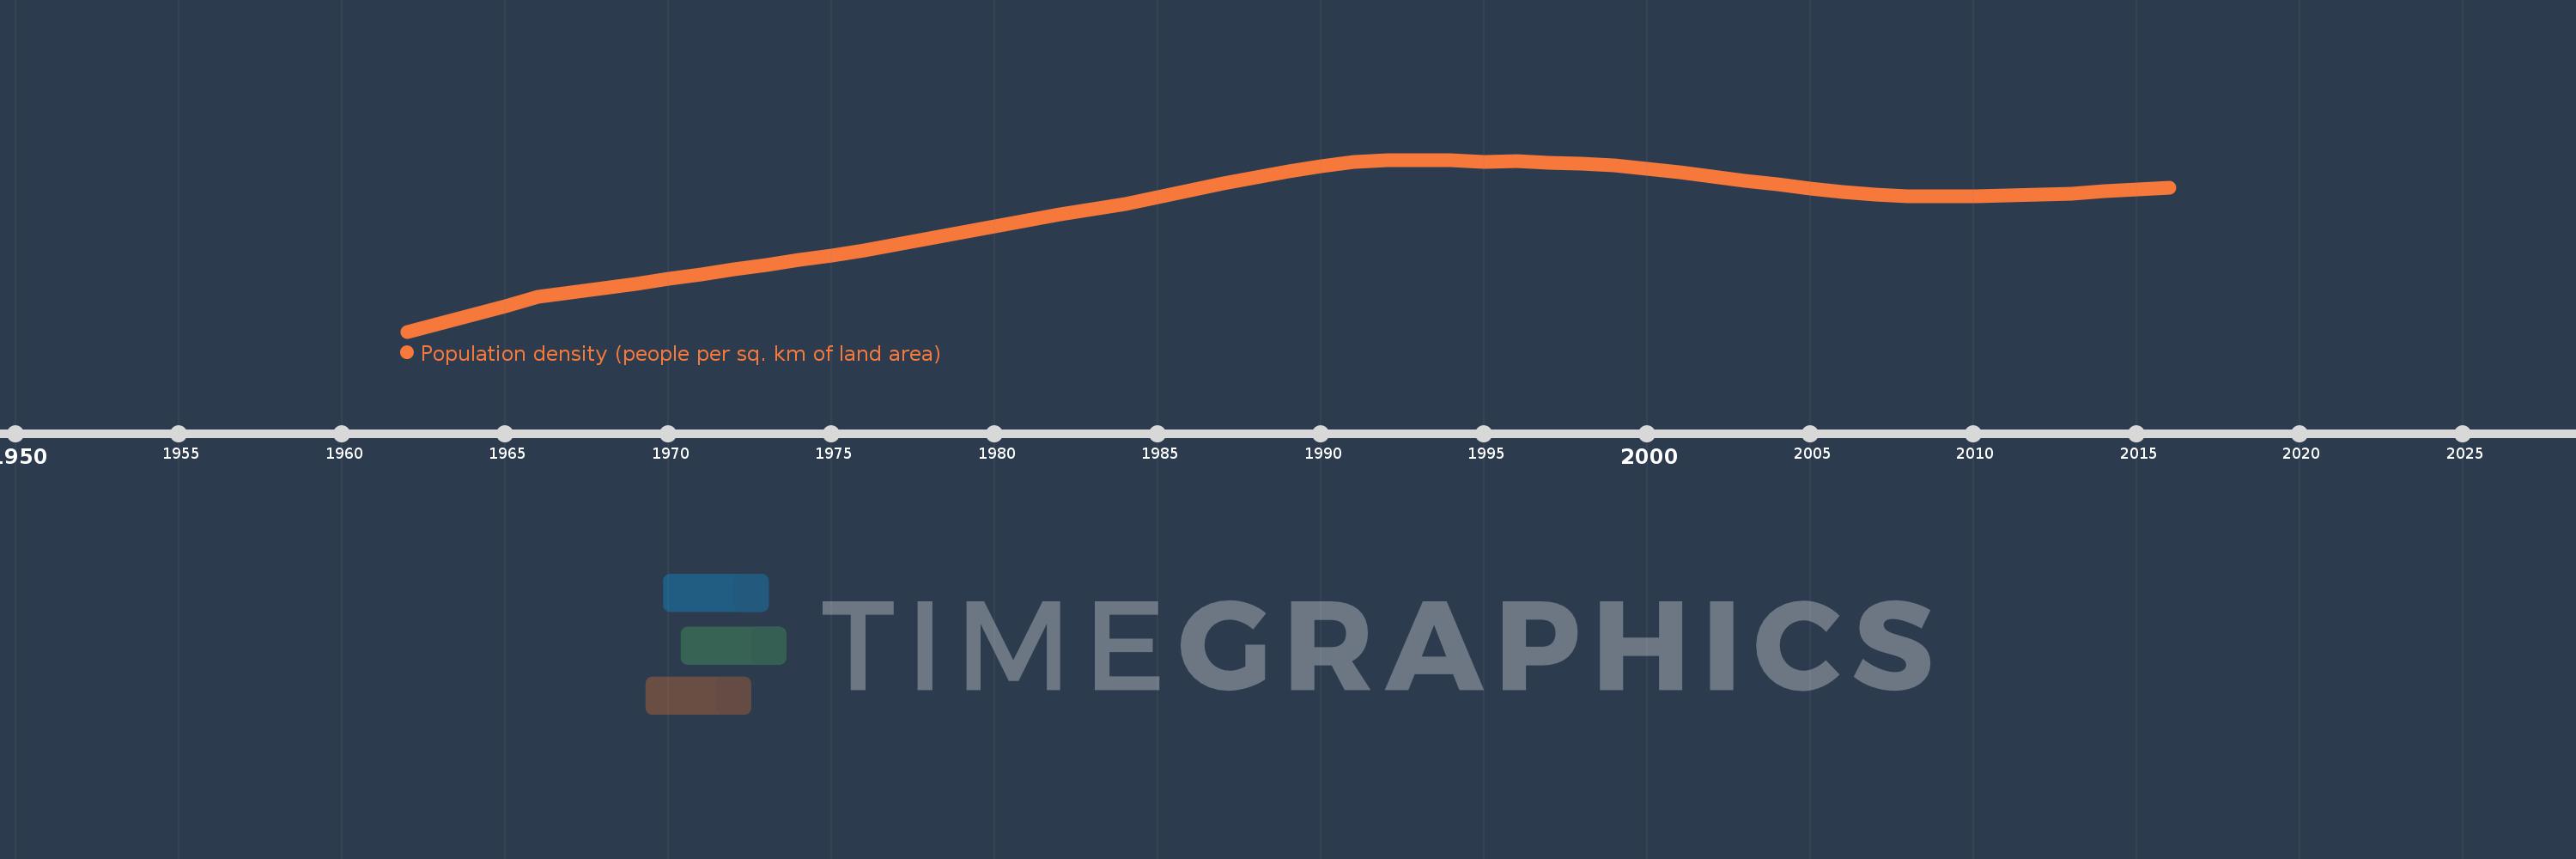
Population density (people per sq. km of land area)
2016,2015,2014,2013,2012,2011,2010,2009,2008,2007,2006,2005,2004,2003,2002,2001,2000,1999,1998,1997,1996,1995,1994,1993,1992,1991,1990,1989,1988,1987,1986,1985,1984,1983,1982,1981,1980,1979,1978,1977,1976,1975,1974,1973,1972,1971,1970,1969,1968,1967,1966,1965,1964,1963,1962
Diese Statistik in anderen Ländern:
AfghanistanAlbaniaAlgeriaAmerican SamoaAndorraAngolaAntigua and BarbudaArab WorldArgentinaArmeniaArubaAustraliaAustriaAzerbaijanBahamas, TheBahrainBangladeshBarbadosBelarusBelgiumBelizeBeninBermudaBhutanBoliviaBosnia and HerzegovinaBotswanaBrazilBritish Virgin IslandsBrunei DarussalamBulgariaBurkina FasoBurundiCabo VerdeCambodiaCameroonCanadaCaribbean small statesCayman IslandsCentral African RepublicCentral Europe and the BalticsChadChannel IslandsChileChinaColombiaComorosCongo, Dem. Rep.Congo, Rep.Costa RicaCote d'IvoireCroatiaCubaCuracaoCyprusCzech RepublicDenmarkDjiboutiDominicaDominican RepublicEarly-demographic dividendEast Asia & PacificEast Asia & Pacific (excluding high income)East Asia & Pacific (IDA & IBRD countries)EcuadorEgypt, Arab Rep.El SalvadorEquatorial GuineaEritreaEstoniaEthiopiaEuro areaEurope & Central AsiaEurope & Central Asia (excluding high income)Europe & Central Asia (IDA & IBRD countries)European UnionFaroe IslandsFijiFinlandFragile and conflict affected situationsFranceFrench PolynesiaGabonGambia, TheGeorgiaGermanyGhanaGibraltarGreeceGreenlandGrenadaGuamGuatemalaGuineaGuinea-BissauGuyanaHaitiHeavily indebted poor countries (HIPC)High incomeHondurasHong Kong SAR, ChinaHungaryIBRD onlyIcelandIDA & IBRD totalIDA blendIDA onlyIDA totalIndiaIndonesiaIran, Islamic Rep.IraqIrelandIsle of ManIsraelItalyJamaicaJapanJordanKazakhstanKenyaKiribatiKorea, Dem. People’s Rep.Korea, Rep.KosovoKuwaitKyrgyz RepublicLao PDRLate-demographic dividendLatin America & Caribbean Latin America & Caribbean (excluding high income)Latin America & the Caribbean (IDA & IBRD countries)LatviaLeast developed countries: UN classificationLebanonLesothoLiberiaLibyaLiechtensteinLithuaniaLow & middle incomeLow incomeLower middle incomeLuxembourgMacao SAR, ChinaMacedonia, FYRMadagascarMalawiMalaysiaMaldivesMaliMaltaMarshall IslandsMauritaniaMauritiusMexicoMicronesia, Fed. Sts.Middle East & North AfricaMiddle East & North Africa (excluding high income)Middle East & North Africa (IDA & IBRD countries)Middle incomeMoldovaMonacoMongoliaMontenegroMoroccoMozambiqueMyanmarNamibiaNauruNepalNetherlandsNew CaledoniaNew ZealandNicaraguaNigerNigeriaNorth AmericaNorthern Mariana IslandsNorwayOECD membersOmanOther small statesPacific island small statesPakistanPalauPanamaPapua New GuineaParaguayPeruPhilippinesPolandPortugalPost-demographic dividendPre-demographic dividendPuerto RicoQatarRomaniaRussian FederationRwandaSamoaSan MarinoSao Tome and PrincipeSaudi ArabiaSenegalSerbiaSeychellesSierra LeoneSingaporeSint Maarten (Dutch part)Slovak RepublicSloveniaSmall statesSolomon IslandsSomaliaSouth AfricaSouth AsiaSouth Asia (IDA & IBRD)SpainSri LankaSt. Kitts and NevisSt. LuciaSt. Martin (French part)St. Vincent and the GrenadinesSub-Saharan Africa Sub-Saharan Africa (excluding high income)Sub-Saharan Africa (IDA & IBRD countries)SudanSurinameSwazilandSwedenSwitzerlandSyrian Arab RepublicTajikistanTanzaniaThailandTimor-LesteTogoTongaTrinidad and TobagoTunisiaTurkeyTurkmenistanTurks and Caicos IslandsTuvaluUgandaUkraineUnited Arab EmiratesUnited KingdomUnited StatesUpper middle incomeUruguayUzbekistanVanuatuVenezuela, RBVietnamVirgin Islands (U.S.)West Bank and GazaWorldYemen, Rep.ZambiaZimbabwe Zeitlinie:
Diese Zeitleiste vorliegt die Graphik ab 1962 J. bis 2016 J. Russian Federation. Die Angaben bis 1961 J. sind nicht vorhanden. Die Zahl aktueller Beobachtungen nach Daten: 55.
Die Quelle (Bezeichnung):
Kennzahlen der Weltentwicklung
Die Quelle (Einrichtung):
Food and Agriculture Organization and World Bank population estimates.
Kategorien:
Urban Development
Es wurde aktualisiert:
23 Apr 2017 Jahr
Kennzahlen der Wertänderungen vom Jahr zum Jahr
Minimum:
7.397
1 Jan 1962 Jahr
Maximum:
9.072
1 Jan 1993 Jahr
Zum Datum der Beobachtung
Wert
Absolute Veränderung
Die Veränderung bezüglich dem vorherigen Wert
1 Jan 1962 Jahr
7.397
+7.397
0.0%
1 Jan 1963 Jahr
7.48
+0.083
1.12%
1 Jan 1964 Jahr
7.563
+0.084
1.12%
1 Jan 1965 Jahr
7.648
+0.085
1.12%
1 Jan 1966 Jahr
7.733
+0.085
1.12%
1 Jan 1967 Jahr
7.777
+0.044
0.57%
1 Jan 1968 Jahr
7.822
+0.044
0.57%
1 Jan 1969 Jahr
7.866
+0.045
0.57%
1 Jan 1970 Jahr
7.911
+0.045
0.57%
1 Jan 1971 Jahr
7.956
+0.045
0.57%
1 Jan 1972 Jahr
8.002
+0.046
0.58%
1 Jan 1973 Jahr
8.048
+0.046
0.57%
1 Jan 1974 Jahr
8.095
+0.046
0.58%
1 Jan 1975 Jahr
8.141
+0.047
0.58%
1 Jan 1976 Jahr
8.188
+0.047
0.58%
1 Jan 1977 Jahr
8.246
+0.058
0.71%
1 Jan 1978 Jahr
8.304
+0.058
0.71%
1 Jan 1979 Jahr
8.362
+0.059
0.71%
1 Jan 1980 Jahr
8.421
+0.059
0.71%
1 Jan 1981 Jahr
8.481
+0.06
0.71%
1 Jan 1982 Jahr
8.538
+0.057
0.67%
1 Jan 1983 Jahr
8.592
+0.054
0.63%
1 Jan 1984 Jahr
8.644
+0.052
0.6%
1 Jan 1985 Jahr
8.709
+0.066
0.76%
1 Jan 1986 Jahr
8.777
+0.068
0.78%
1 Jan 1987 Jahr
8.84
+0.063
0.72%
1 Jan 1988 Jahr
8.902
+0.062
0.7%
1 Jan 1989 Jahr
8.96
+0.058
0.65%
1 Jan 1990 Jahr
9.013
+0.053
0.59%
1 Jan 1991 Jahr
9.048
+0.035
0.39%
1 Jan 1992 Jahr
9.068
+0.02
0.22%
1 Jan 1993 Jahr
9.072
+0.004
0.04%
1 Jan 1994 Jahr
9.064
-0.008
-0.09%
1 Jan 1995 Jahr
9.055
-0.009
-0.09%
1 Jan 1996 Jahr
9.059
+0.004
0.04%
1 Jan 1997 Jahr
9.046
-0.013
-0.14%
1 Jan 1998 Jahr
9.031
-0.015
-0.17%
1 Jan 1999 Jahr
9.015
-0.016
-0.18%
1 Jan 2000 Jahr
8.983
-0.032
-0.35%
1 Jan 2001 Jahr
8.949
-0.034
-0.38%
1 Jan 2002 Jahr
8.912
-0.037
-0.42%
1 Jan 2003 Jahr
8.87
-0.041
-0.46%
1 Jan 2004 Jahr
8.83
-0.04
-0.45%
1 Jan 2005 Jahr
8.795
-0.036
-0.4%
1 Jan 2006 Jahr
8.761
-0.034
-0.38%
1 Jan 2007 Jahr
8.734
-0.027
-0.3%
1 Jan 2008 Jahr
8.719
-0.015
-0.17%
1 Jan 2009 Jahr
8.716
-0.003
-0.04%
1 Jan 2010 Jahr
8.719
+0.003
0.03%
1 Jan 2011 Jahr
8.723
+0.004
0.04%
1 Jan 2012 Jahr
8.729
+0.007
0.08%
1 Jan 2013 Jahr
8.744
+0.015
0.17%
1 Jan 2014 Jahr
8.763
+0.019
0.21%
1 Jan 2015 Jahr
8.782
+0.019
0.22%
1 Jan 2016 Jahr
8.799
+0.017
0.19%
Bewertung der Länder gemäß mit laufender Statistik nach Jahren


Kommentare: