33
/
AIzaSyB4mHJ5NPEv-XzF7P6NDYXjlkCWaeKw5bc
November 30, 2025
94093
Bulgaria
BGR
true
2
1
PPG, IBRD (DOD, current US$)
2016,2015,2014,2013,2012,2011,2010,2009,2008,2007,2006,2005,2004,2003,2002,2001,2000,1999,1998,1997,1996,1995,1994,1993,1992
Create a timeline
Public Timelines
For education
For educational institutions
For teachers
For students
Cabinet
For educational institutions
For teachers
For students
Open cabinet
FAQ
Close
Create a timeline
Public timelines
FAQ
About & Feedback
Terms
Privacy
FAQ
Support 24/7
Cabinet
Get premium
Donate
Download
Global statistics library
→
Bulgaria
→
PPG, IBRD (DOD, current US$)
This statistics in other country:
Albania
Algeria
Angola
Argentina
Armenia
Azerbaijan
Bangladesh
Belarus
Belize
Bolivia
Bosnia and Herzegovina
Botswana
Brazil
Bulgaria
Burundi
Cabo Verde
Cameroon
Chad
China
Colombia
Congo, Dem. Rep.
Congo, Rep.
Costa Rica
Cote d'Ivoire
Dominica
Dominican Republic
East Asia & Pacific (excluding high income)
Ecuador
Egypt, Arab Rep.
El Salvador
Ethiopia
Europe & Central Asia (excluding high income)
Fiji
Gabon
Georgia
Ghana
Grenada
Guatemala
Guinea
Guyana
Honduras
IDA only
India
Indonesia
Iran, Islamic Rep.
Jamaica
Jordan
Kazakhstan
Kenya
Kosovo
Latin America & Caribbean (excluding high income)
Lebanon
Lesotho
Liberia
Low & middle income
Low income
Lower middle income
Macedonia, FYR
Madagascar
Malawi
Malaysia
Mauritania
Mauritius
Mexico
Middle East & North Africa (excluding high income)
Middle income
Moldova
Montenegro
Morocco
Myanmar
Nicaragua
Nigeria
Pakistan
Panama
Papua New Guinea
Paraguay
Peru
Philippines
Romania
Russian Federation
Senegal
Serbia
Sierra Leone
South Africa
South Asia
Sri Lanka
St. Lucia
St. Vincent and the Grenadines
Sub-Saharan Africa (excluding high income)
Sudan
Swaziland
Syrian Arab Republic
Tanzania
Thailand
Togo
Tunisia
Turkey
Turkmenistan
Uganda
Ukraine
Upper middle income
Uzbekistan
Venezuela, RB
Vietnam
Zambia
Zimbabwe
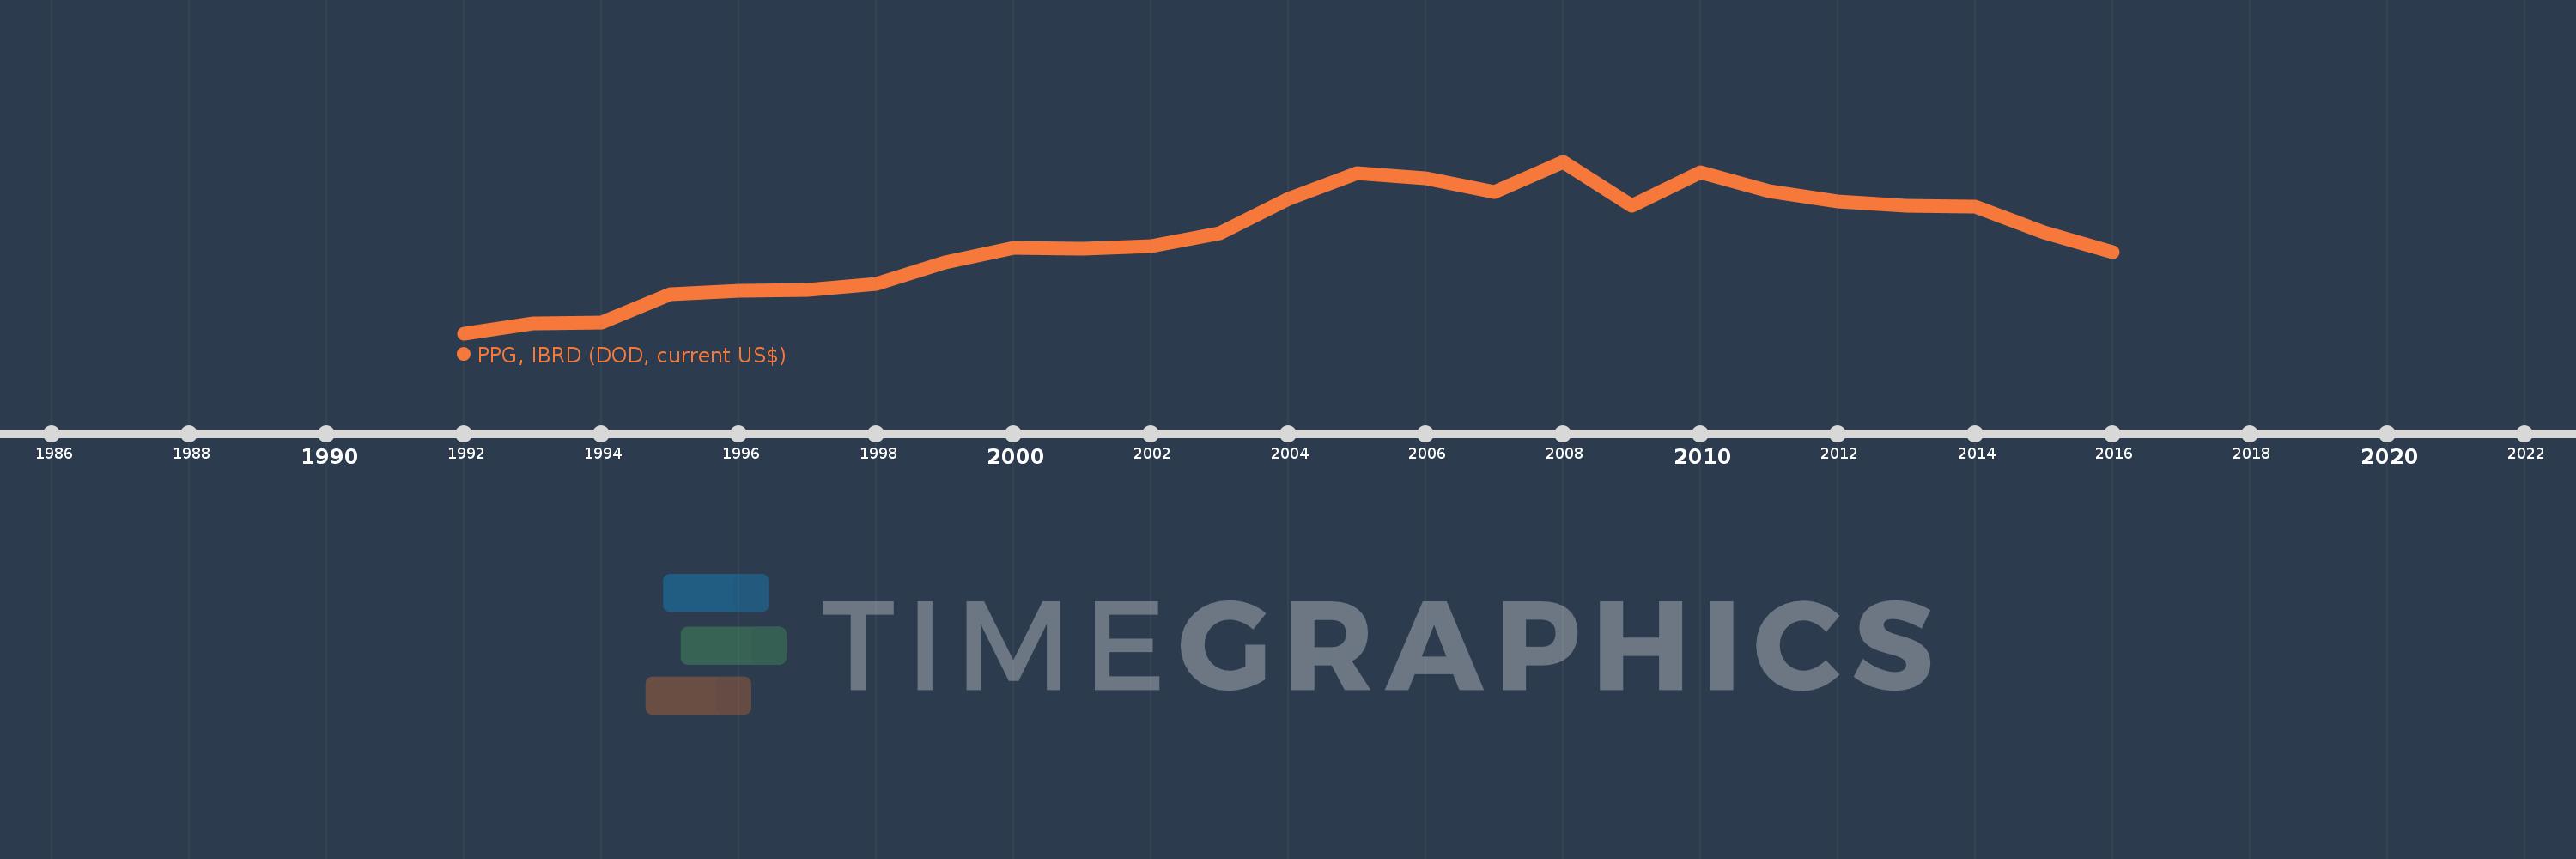
Timeline:
This timeline shows a graph from
1992
to
2016
of Bulgaria. No data until
1991
. Number of actual observations by date:
25
.
Source name:
World Development Indicators
Source organization:
World Bank, International Debt Statistics.
Categories, topics:
External Debt
Last updated:
apr 23, 2017
Indicators value changes by year
Meaning:
918.08 mln
Minimum:
60.531 mln
jan 1, 1992
Maximum:
1.604 bln
jan 1, 2008
At the date of observation
Value
Absolute change
Change from the previous value
jan 1, 1992
60.531 mln
+60.531 mln
0.0%
jan 1, 1993
152.235 mln
+91.704 mln
151.5%
jan 1, 1994
158.002 mln
+5.767 mln
3.79%
jan 1, 1995
415.41 mln
+257.408 mln
162.91%
jan 1, 1996
443.54 mln
+28.13 mln
6.77%
jan 1, 1997
452.872 mln
+9.332 mln
2.1%
jan 1, 1998
501.322 mln
+48.45 mln
10.7%
jan 1, 1999
697.094 mln
+195.772 mln
39.05%
jan 1, 2000
828.896 mln
+131.802 mln
18.91%
jan 1, 2001
824.229 mln
-4.667 mln
-0.56%
jan 1, 2002
844.337 mln
+20.108 mln
2.44%
jan 1, 2003
958.416 mln
+114.079 mln
13.51%
jan 1, 2004
1.266 bln
+307.504 mln
32.08%
jan 1, 2005
1.498 bln
+231.911 mln
18.32%
jan 1, 2006
1.453 bln
-44.78 mln
-2.99%
jan 1, 2007
1.331 bln
-122.335 mln
-8.42%
jan 1, 2008
1.604 bln
+272.9 mln
20.51%
jan 1, 2009
1.207 bln
-396.943 mln
-24.75%
jan 1, 2010
1.509 bln
+302.789 mln
25.09%
jan 1, 2011
1.338 bln
-171.137 mln
-11.34%
jan 1, 2012
1.244 bln
-94.565 mln
-7.07%
jan 1, 2013
1.21 bln
-33.912 mln
-2.73%
jan 1, 2014
1.201 bln
-8.832 mln
-0.73%
jan 1, 2015
969.004 mln
-232.012 mln
-19.32%
jan 1, 2016
785.901 mln
-183.103 mln
-18.9%
Ranking of countries by current statistics by years
About & Feedback
Terms
Privacy
FAQ
Support 24/7
Cabinet
Get premium
Donate
The service accepts bank transfer (ACH, Wire) or cards (Visa, MasterCard, etc). Processed by Stripe.
Secured with SSL