33
/
AIzaSyB4mHJ5NPEv-XzF7P6NDYXjlkCWaeKw5bc
November 30, 2025
230289
Russian Federation
RUS
true
2
1
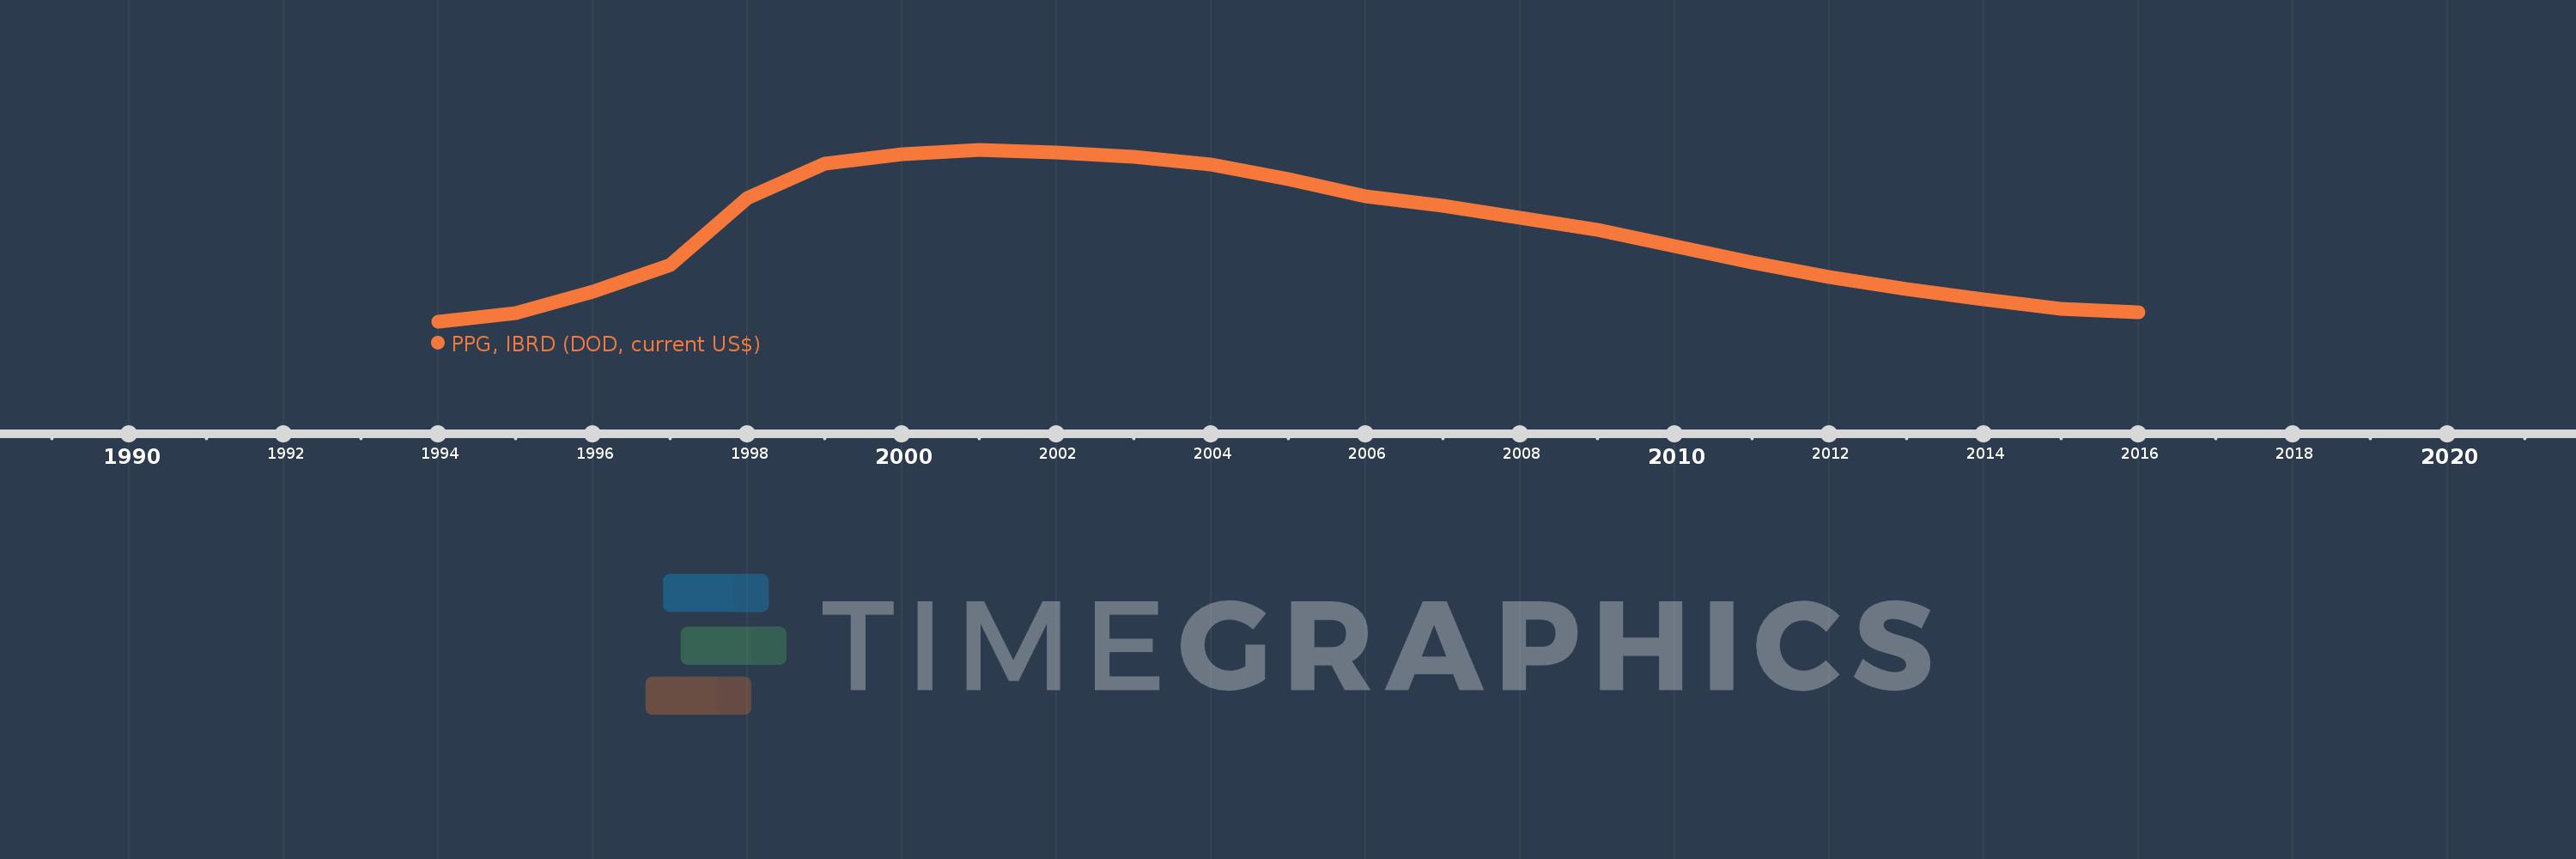
PPG, IBRD (DOD, current US$)
2016,2015,2014,2013,2012,2011,2010,2009,2008,2007,2006,2005,2004,2003,2002,2001,2000,1999,1998,1997,1996,1995,1994
Create a timeline
Public Timelines
For education
For educational institutions
For teachers
For students
Cabinet
For educational institutions
For teachers
For students
Open cabinet
FAQ
Close
Create a timeline
Public timelines
FAQ
About & Feedback
Terms
Privacy
FAQ
Support 24/7
Cabinet
Get premium
Donate
Download
Global statistics library
→
Russian Federation
→
PPG, IBRD (DOD, current US$)
This statistics in other country:
Albania
Algeria
Angola
Argentina
Armenia
Azerbaijan
Bangladesh
Belarus
Belize
Bolivia
Bosnia and Herzegovina
Botswana
Brazil
Bulgaria
Burundi
Cabo Verde
Cameroon
Chad
China
Colombia
Congo, Dem. Rep.
Congo, Rep.
Costa Rica
Cote d'Ivoire
Dominica
Dominican Republic
East Asia & Pacific (excluding high income)
Ecuador
Egypt, Arab Rep.
El Salvador
Ethiopia
Europe & Central Asia (excluding high income)
Fiji
Gabon
Georgia
Ghana
Grenada
Guatemala
Guinea
Guyana
Honduras
IDA only
India
Indonesia
Iran, Islamic Rep.
Jamaica
Jordan
Kazakhstan
Kenya
Kosovo
Latin America & Caribbean (excluding high income)
Lebanon
Lesotho
Liberia
Low & middle income
Low income
Lower middle income
Macedonia, FYR
Madagascar
Malawi
Malaysia
Mauritania
Mauritius
Mexico
Middle East & North Africa (excluding high income)
Middle income
Moldova
Montenegro
Morocco
Myanmar
Nicaragua
Nigeria
Pakistan
Panama
Papua New Guinea
Paraguay
Peru
Philippines
Romania
Russian Federation
Senegal
Serbia
Sierra Leone
South Africa
South Asia
Sri Lanka
St. Lucia
St. Vincent and the Grenadines
Sub-Saharan Africa (excluding high income)
Sudan
Swaziland
Syrian Arab Republic
Tanzania
Thailand
Togo
Tunisia
Turkey
Turkmenistan
Uganda
Ukraine
Upper middle income
Uzbekistan
Venezuela, RB
Vietnam
Zambia
Zimbabwe
Timeline:
This timeline shows a graph from
1994
to
2016
of Russian Federation. No data until
1993
. Number of actual observations by date:
23
.
Source name:
World Development Indicators
Source organization:
World Bank, International Debt Statistics.
Categories, topics:
External Debt
Last updated:
apr 23, 2017
Indicators value changes by year
Meaning:
3.727 bln
Minimum:
366.857 mln
jan 1, 1994
Maximum:
6.844 bln
jan 1, 2001
At the date of observation
Value
Absolute change
Change from the previous value
jan 1, 1994
366.857 mln
+366.857 mln
0.0%
jan 1, 1995
684.286 mln
+317.429 mln
86.53%
jan 1, 1996
1.524 bln
+839.591 mln
122.7%
jan 1, 1997
2.509 bln
+985.088 mln
64.64%
jan 1, 1998
5.053 bln
+2.544 bln
101.4%
jan 1, 1999
6.337 bln
+1.284 bln
25.4%
jan 1, 2000
6.707 bln
+370.238 mln
5.84%
jan 1, 2001
6.844 bln
+136.727 mln
2.04%
jan 1, 2002
6.746 bln
-98.034 mln
-1.43%
jan 1, 2003
6.599 bln
-147.02 mln
-2.18%
jan 1, 2004
6.289 bln
-309.441 mln
-4.69%
jan 1, 2005
5.743 bln
-545.715 mln
-8.68%
jan 1, 2006
5.091 bln
-652.098 mln
-11.35%
jan 1, 2007
4.759 bln
-332.446 mln
-6.53%
jan 1, 2008
4.292 bln
-467.15 mln
-9.82%
jan 1, 2009
3.851 bln
-440.792 mln
-10.27%
jan 1, 2010
3.211 bln
-640.297 mln
-16.63%
jan 1, 2011
2.618 bln
-592.363 mln
-18.45%
jan 1, 2012
2.067 bln
-551.356 mln
-21.06%
jan 1, 2013
1.61 bln
-457.061 mln
-22.11%
jan 1, 2014
1.204 bln
-406.025 mln
-25.22%
jan 1, 2015
876.048 mln
-327.821 mln
-27.23%
jan 1, 2016
730.681 mln
-145.367 mln
-16.59%
Ranking of countries by current statistics by years
About & Feedback
Terms
Privacy
FAQ
Support 24/7
Cabinet
Get premium
Donate
The service accepts bank transfer (ACH, Wire) or cards (Visa, MasterCard, etc). Processed by Stripe.
Secured with SSL