33
/
AIzaSyB4mHJ5NPEv-XzF7P6NDYXjlkCWaeKw5bc
November 30, 2025
198105
Moldova
MDA
true
2
1
PPG, IBRD (DOD, current US$)
2016,2015,2014,2013,2012,2011,2010,2009,2008,2007,2006,2005,2004,2003,2002,2001,2000,1999,1998,1997,1996,1995,1994
Create a timeline
Public Timelines
For education
For educational institutions
For teachers
For students
Cabinet
For educational institutions
For teachers
For students
Open cabinet
FAQ
Close
Create a timeline
Public timelines
FAQ
About & Feedback
Terms
Privacy
FAQ
Support 24/7
Cabinet
Get premium
Donate
Download
Global statistics library
→
Moldova
→
PPG, IBRD (DOD, current US$)
This statistics in other country:
Albania
Algeria
Angola
Argentina
Armenia
Azerbaijan
Bangladesh
Belarus
Belize
Bolivia
Bosnia and Herzegovina
Botswana
Brazil
Bulgaria
Burundi
Cabo Verde
Cameroon
Chad
China
Colombia
Congo, Dem. Rep.
Congo, Rep.
Costa Rica
Cote d'Ivoire
Dominica
Dominican Republic
East Asia & Pacific (excluding high income)
Ecuador
Egypt, Arab Rep.
El Salvador
Ethiopia
Europe & Central Asia (excluding high income)
Fiji
Gabon
Georgia
Ghana
Grenada
Guatemala
Guinea
Guyana
Honduras
IDA only
India
Indonesia
Iran, Islamic Rep.
Jamaica
Jordan
Kazakhstan
Kenya
Kosovo
Latin America & Caribbean (excluding high income)
Lebanon
Lesotho
Liberia
Low & middle income
Low income
Lower middle income
Macedonia, FYR
Madagascar
Malawi
Malaysia
Mauritania
Mauritius
Mexico
Middle East & North Africa (excluding high income)
Middle income
Moldova
Montenegro
Morocco
Myanmar
Nicaragua
Nigeria
Pakistan
Panama
Papua New Guinea
Paraguay
Peru
Philippines
Romania
Russian Federation
Senegal
Serbia
Sierra Leone
South Africa
South Asia
Sri Lanka
St. Lucia
St. Vincent and the Grenadines
Sub-Saharan Africa (excluding high income)
Sudan
Swaziland
Syrian Arab Republic
Tanzania
Thailand
Togo
Tunisia
Turkey
Turkmenistan
Uganda
Ukraine
Upper middle income
Uzbekistan
Venezuela, RB
Vietnam
Zambia
Zimbabwe
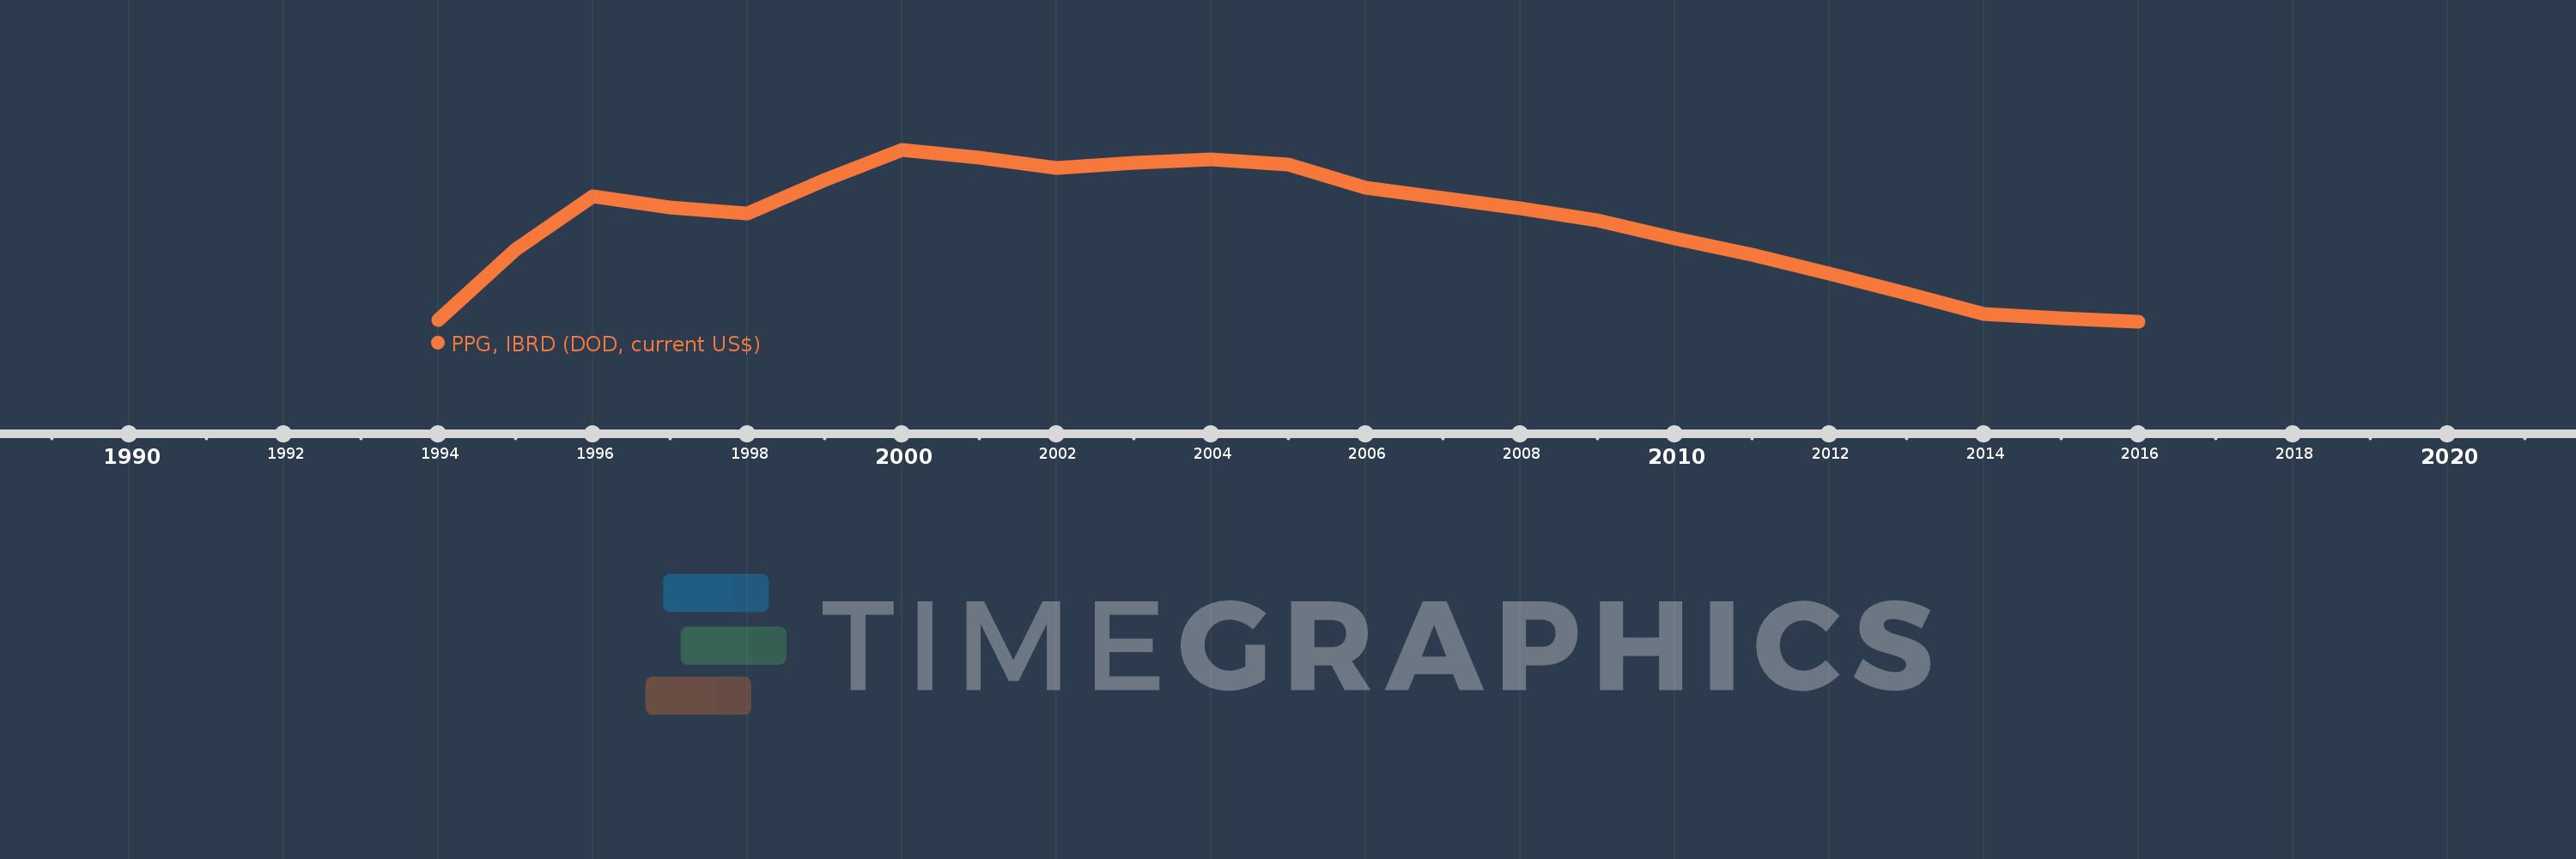
Timeline:
This timeline shows a graph from
1994
to
2016
of Moldova. No data until
1993
. Number of actual observations by date:
23
.
Source name:
World Development Indicators
Source organization:
World Bank, International Debt Statistics.
Categories, topics:
External Debt
Last updated:
apr 23, 2017
Indicators value changes by year
Meaning:
124.435 mln
Minimum:
26.084 mln
jan 1, 2016
Maximum:
198.819 mln
jan 1, 2000
At the date of observation
Value
Absolute change
Change from the previous value
jan 1, 1994
28.112 mln
+28.112 mln
0.0%
jan 1, 1995
98.796 mln
+70.684 mln
251.44%
jan 1, 1996
152.402 mln
+53.606 mln
54.26%
jan 1, 1997
141.642 mln
-10.76 mln
-7.06%
jan 1, 1998
135.339 mln
-6.303 mln
-4.45%
jan 1, 1999
168.719 mln
+33.38 mln
24.66%
jan 1, 2000
198.819 mln
+30.1 mln
17.84%
jan 1, 2001
191.23 mln
-7.589 mln
-3.82%
jan 1, 2002
180.545 mln
-10.685 mln
-5.59%
jan 1, 2003
186.237 mln
+5.692 mln
3.15%
jan 1, 2004
189.784 mln
+3.547 mln
1.9%
jan 1, 2005
184.684 mln
-5.1 mln
-2.69%
jan 1, 2006
161.365 mln
-23.319 mln
-12.63%
jan 1, 2007
151.073 mln
-10.292 mln
-6.38%
jan 1, 2008
140.63 mln
-10.443 mln
-6.91%
jan 1, 2009
128.566 mln
-12.064 mln
-8.58%
jan 1, 2010
110.436 mln
-18.13 mln
-14.1%
jan 1, 2011
93.327 mln
-17.109 mln
-15.49%
jan 1, 2012
75.132 mln
-18.195 mln
-19.5%
jan 1, 2013
55.136 mln
-19.996 mln
-26.61%
jan 1, 2014
34.542 mln
-20.594 mln
-37.35%
jan 1, 2015
29.41 mln
-5.132 mln
-14.86%
jan 1, 2016
26.084 mln
-3.326 mln
-11.31%
Ranking of countries by current statistics by years
About & Feedback
Terms
Privacy
FAQ
Support 24/7
Cabinet
Get premium
Donate
The service accepts bank transfer (ACH, Wire) or cards (Visa, MasterCard, etc). Processed by Stripe.
Secured with SSL