33
/
AIzaSyB4mHJ5NPEv-XzF7P6NDYXjlkCWaeKw5bc
November 30, 2025
193519
Mauritania
MRT
true
2
1
PPG, IBRD (DOD, current US$)
2001,2000,1999,1998,1997,1996,1995,1994,1993,1992,1991,1990,1989,1988,1987,1986,1985,1984,1983,1982,1981,1980,1976,1975
Create a timeline
Public Timelines
For education
For educational institutions
For teachers
For students
Cabinet
For educational institutions
For teachers
For students
Open cabinet
FAQ
Close
Create a timeline
Public timelines
FAQ
About & Feedback
Terms
Privacy
FAQ
Support 24/7
Cabinet
Get premium
Donate
Download
Global statistics library
→
Mauritania
→
PPG, IBRD (DOD, current US$)
This statistics in other country:
Albania
Algeria
Angola
Argentina
Armenia
Azerbaijan
Bangladesh
Belarus
Belize
Bolivia
Bosnia and Herzegovina
Botswana
Brazil
Bulgaria
Burundi
Cabo Verde
Cameroon
Chad
China
Colombia
Congo, Dem. Rep.
Congo, Rep.
Costa Rica
Cote d'Ivoire
Dominica
Dominican Republic
East Asia & Pacific (excluding high income)
Ecuador
Egypt, Arab Rep.
El Salvador
Ethiopia
Europe & Central Asia (excluding high income)
Fiji
Gabon
Georgia
Ghana
Grenada
Guatemala
Guinea
Guyana
Honduras
IDA only
India
Indonesia
Iran, Islamic Rep.
Jamaica
Jordan
Kazakhstan
Kenya
Kosovo
Latin America & Caribbean (excluding high income)
Lebanon
Lesotho
Liberia
Low & middle income
Low income
Lower middle income
Macedonia, FYR
Madagascar
Malawi
Malaysia
Mauritania
Mauritius
Mexico
Middle East & North Africa (excluding high income)
Middle income
Moldova
Montenegro
Morocco
Myanmar
Nicaragua
Nigeria
Pakistan
Panama
Papua New Guinea
Paraguay
Peru
Philippines
Romania
Russian Federation
Senegal
Serbia
Sierra Leone
South Africa
South Asia
Sri Lanka
St. Lucia
St. Vincent and the Grenadines
Sub-Saharan Africa (excluding high income)
Sudan
Swaziland
Syrian Arab Republic
Tanzania
Thailand
Togo
Tunisia
Turkey
Turkmenistan
Uganda
Ukraine
Upper middle income
Uzbekistan
Venezuela, RB
Vietnam
Zambia
Zimbabwe
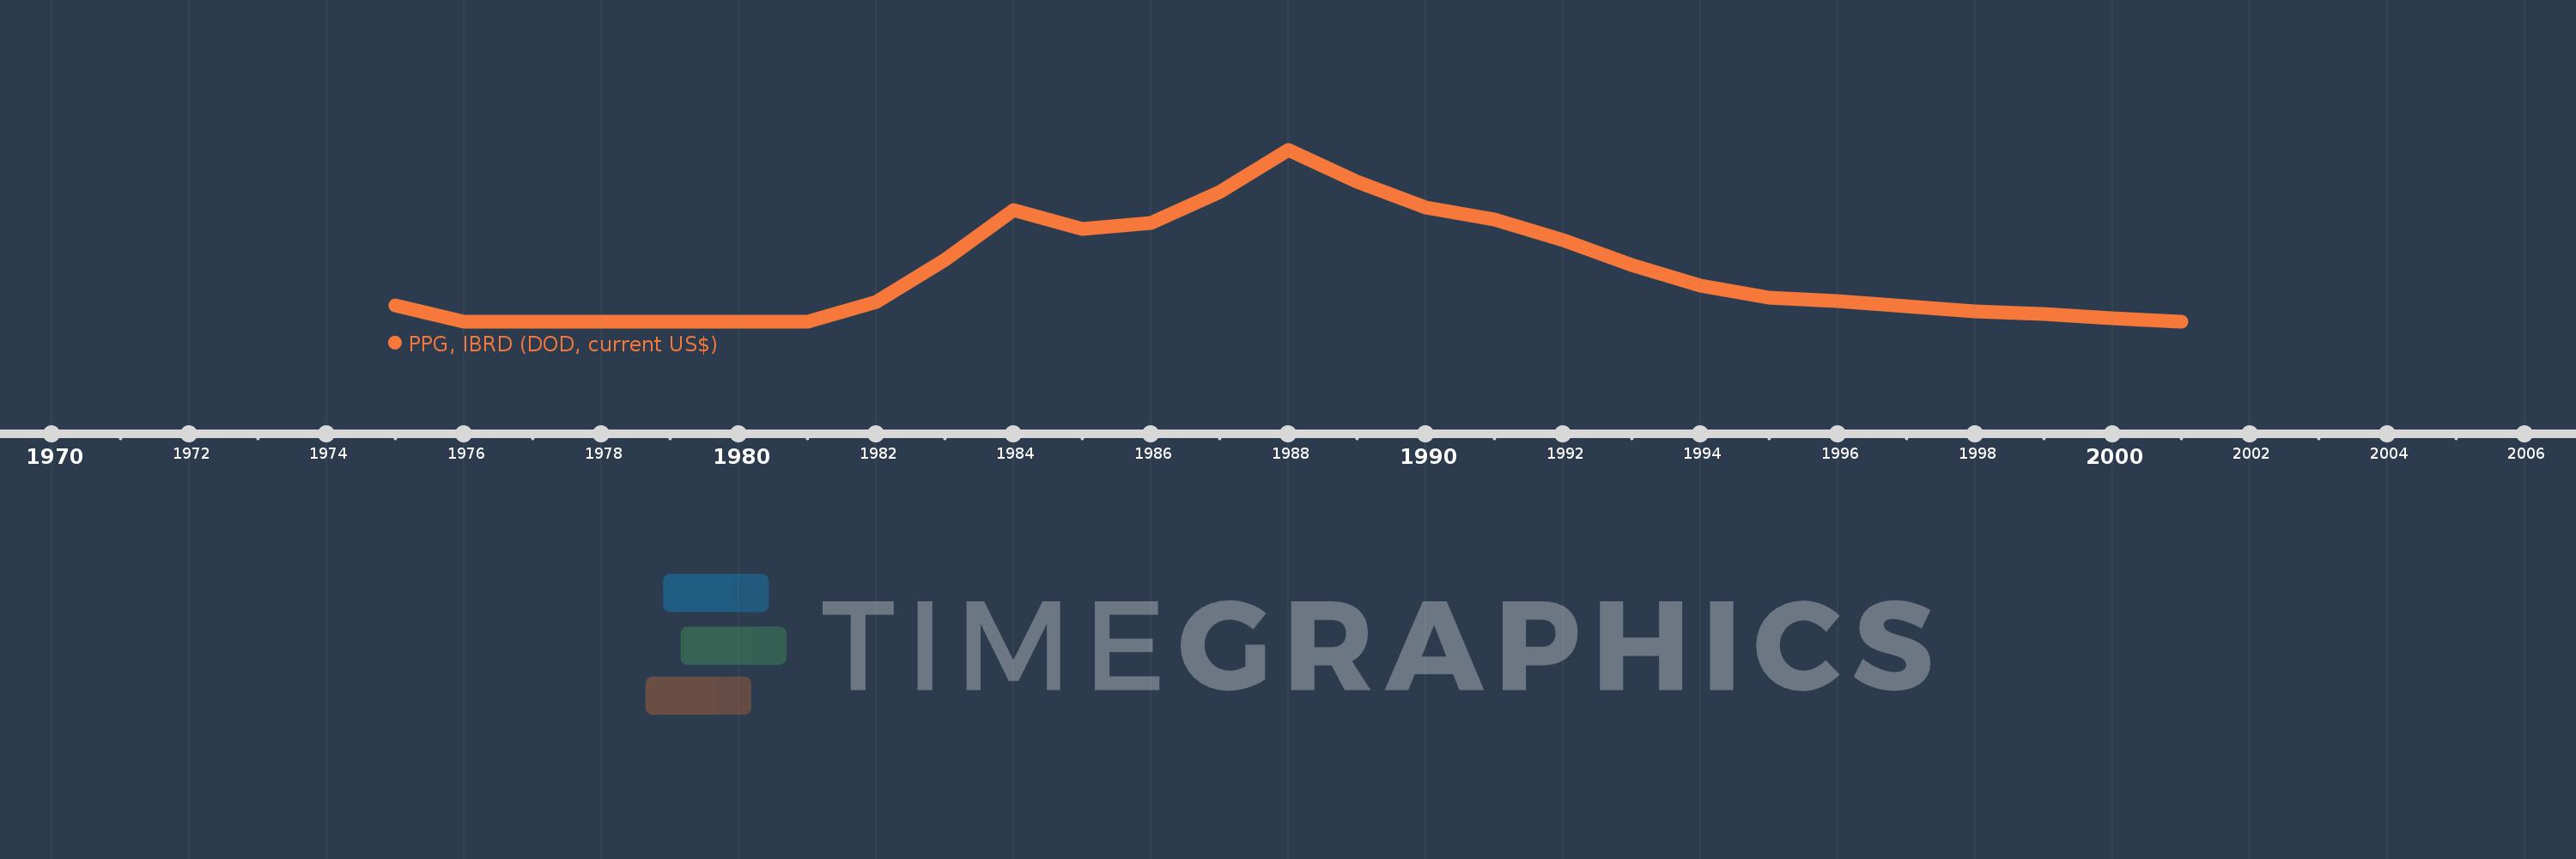
Timeline:
This timeline shows a graph from
1975
to
2001
of Mauritania. No data until
1974
. Number of actual observations by date:
24
.
Source name:
World Development Indicators
Source organization:
World Bank, International Debt Statistics.
Categories, topics:
External Debt
Last updated:
apr 23, 2017
Indicators value changes by year
Meaning:
29.06 mln
Minimum:
0.0
jan 1, 1976
Maximum:
90.867 mln
jan 1, 1988
At the date of observation
Value
Absolute change
Change from the previous value
jan 1, 1975
8.65 mln
+8.65 mln
0.0%
jan 1, 1976
0.0
-8.65 mln
-100.0%
jan 1, 1980
0.0
0.0
%
jan 1, 1981
0.0
0.0
%
jan 1, 1982
10.519 mln
+10.519 mln
%
jan 1, 1983
32.814 mln
+22.295 mln
211.95%
jan 1, 1984
59.16 mln
+26.346 mln
80.29%
jan 1, 1985
49.322 mln
-9.838 mln
-16.63%
jan 1, 1986
52.49 mln
+3.168 mln
6.42%
jan 1, 1987
68.785 mln
+16.295 mln
31.04%
jan 1, 1988
90.867 mln
+22.082 mln
32.1%
jan 1, 1989
74.111 mln
-16.756 mln
-18.44%
jan 1, 1990
60.72 mln
-13.391 mln
-18.07%
jan 1, 1991
54.052 mln
-6.668 mln
-10.98%
jan 1, 1992
43.343 mln
-10.709 mln
-19.81%
jan 1, 1993
30.261 mln
-13.082 mln
-30.18%
jan 1, 1994
19.072 mln
-11.189 mln
-36.97%
jan 1, 1995
12.705 mln
-6.367 mln
-33.38%
jan 1, 1996
10.926 mln
-1.779 mln
-14.0%
jan 1, 1997
8.114 mln
-2.812 mln
-25.74%
jan 1, 1998
5.58 mln
-2.534 mln
-31.23%
jan 1, 1999
4.007 mln
-1.573 mln
-28.19%
jan 1, 2000
1.934 mln
-2.073 mln
-51.73%
jan 1, 2001
0.0
-1.934 mln
-100.0%
Ranking of countries by current statistics by years
About & Feedback
Terms
Privacy
FAQ
Support 24/7
Cabinet
Get premium
Donate
The service accepts bank transfer (ACH, Wire) or cards (Visa, MasterCard, etc). Processed by Stripe.
Secured with SSL