33
/
AIzaSyB4mHJ5NPEv-XzF7P6NDYXjlkCWaeKw5bc
November 30, 2025
81084
Belarus
BLR
true
2
1
PPG, IBRD (DOD, current US$)
2016,2015,2014,2013,2012,2011,2010,2009,2008,2007,2006,2005,2004,2003,2002,2001,2000,1999,1998,1997,1996,1995,1994
Create a timeline
Public Timelines
For education
For educational institutions
For teachers
For students
Cabinet
For educational institutions
For teachers
For students
Open cabinet
FAQ
Close
Create a timeline
Public timelines
FAQ
About & Feedback
Terms
Privacy
FAQ
Support 24/7
Cabinet
Get premium
Donate
Download
Global statistics library
→
Belarus
→
PPG, IBRD (DOD, current US$)
This statistics in other country:
Albania
Algeria
Angola
Argentina
Armenia
Azerbaijan
Bangladesh
Belarus
Belize
Bolivia
Bosnia and Herzegovina
Botswana
Brazil
Bulgaria
Burundi
Cabo Verde
Cameroon
Chad
China
Colombia
Congo, Dem. Rep.
Congo, Rep.
Costa Rica
Cote d'Ivoire
Dominica
Dominican Republic
East Asia & Pacific (excluding high income)
Ecuador
Egypt, Arab Rep.
El Salvador
Ethiopia
Europe & Central Asia (excluding high income)
Fiji
Gabon
Georgia
Ghana
Grenada
Guatemala
Guinea
Guyana
Honduras
IDA only
India
Indonesia
Iran, Islamic Rep.
Jamaica
Jordan
Kazakhstan
Kenya
Kosovo
Latin America & Caribbean (excluding high income)
Lebanon
Lesotho
Liberia
Low & middle income
Low income
Lower middle income
Macedonia, FYR
Madagascar
Malawi
Malaysia
Mauritania
Mauritius
Mexico
Middle East & North Africa (excluding high income)
Middle income
Moldova
Montenegro
Morocco
Myanmar
Nicaragua
Nigeria
Pakistan
Panama
Papua New Guinea
Paraguay
Peru
Philippines
Romania
Russian Federation
Senegal
Serbia
Sierra Leone
South Africa
South Asia
Sri Lanka
St. Lucia
St. Vincent and the Grenadines
Sub-Saharan Africa (excluding high income)
Sudan
Swaziland
Syrian Arab Republic
Tanzania
Thailand
Togo
Tunisia
Turkey
Turkmenistan
Uganda
Ukraine
Upper middle income
Uzbekistan
Venezuela, RB
Vietnam
Zambia
Zimbabwe
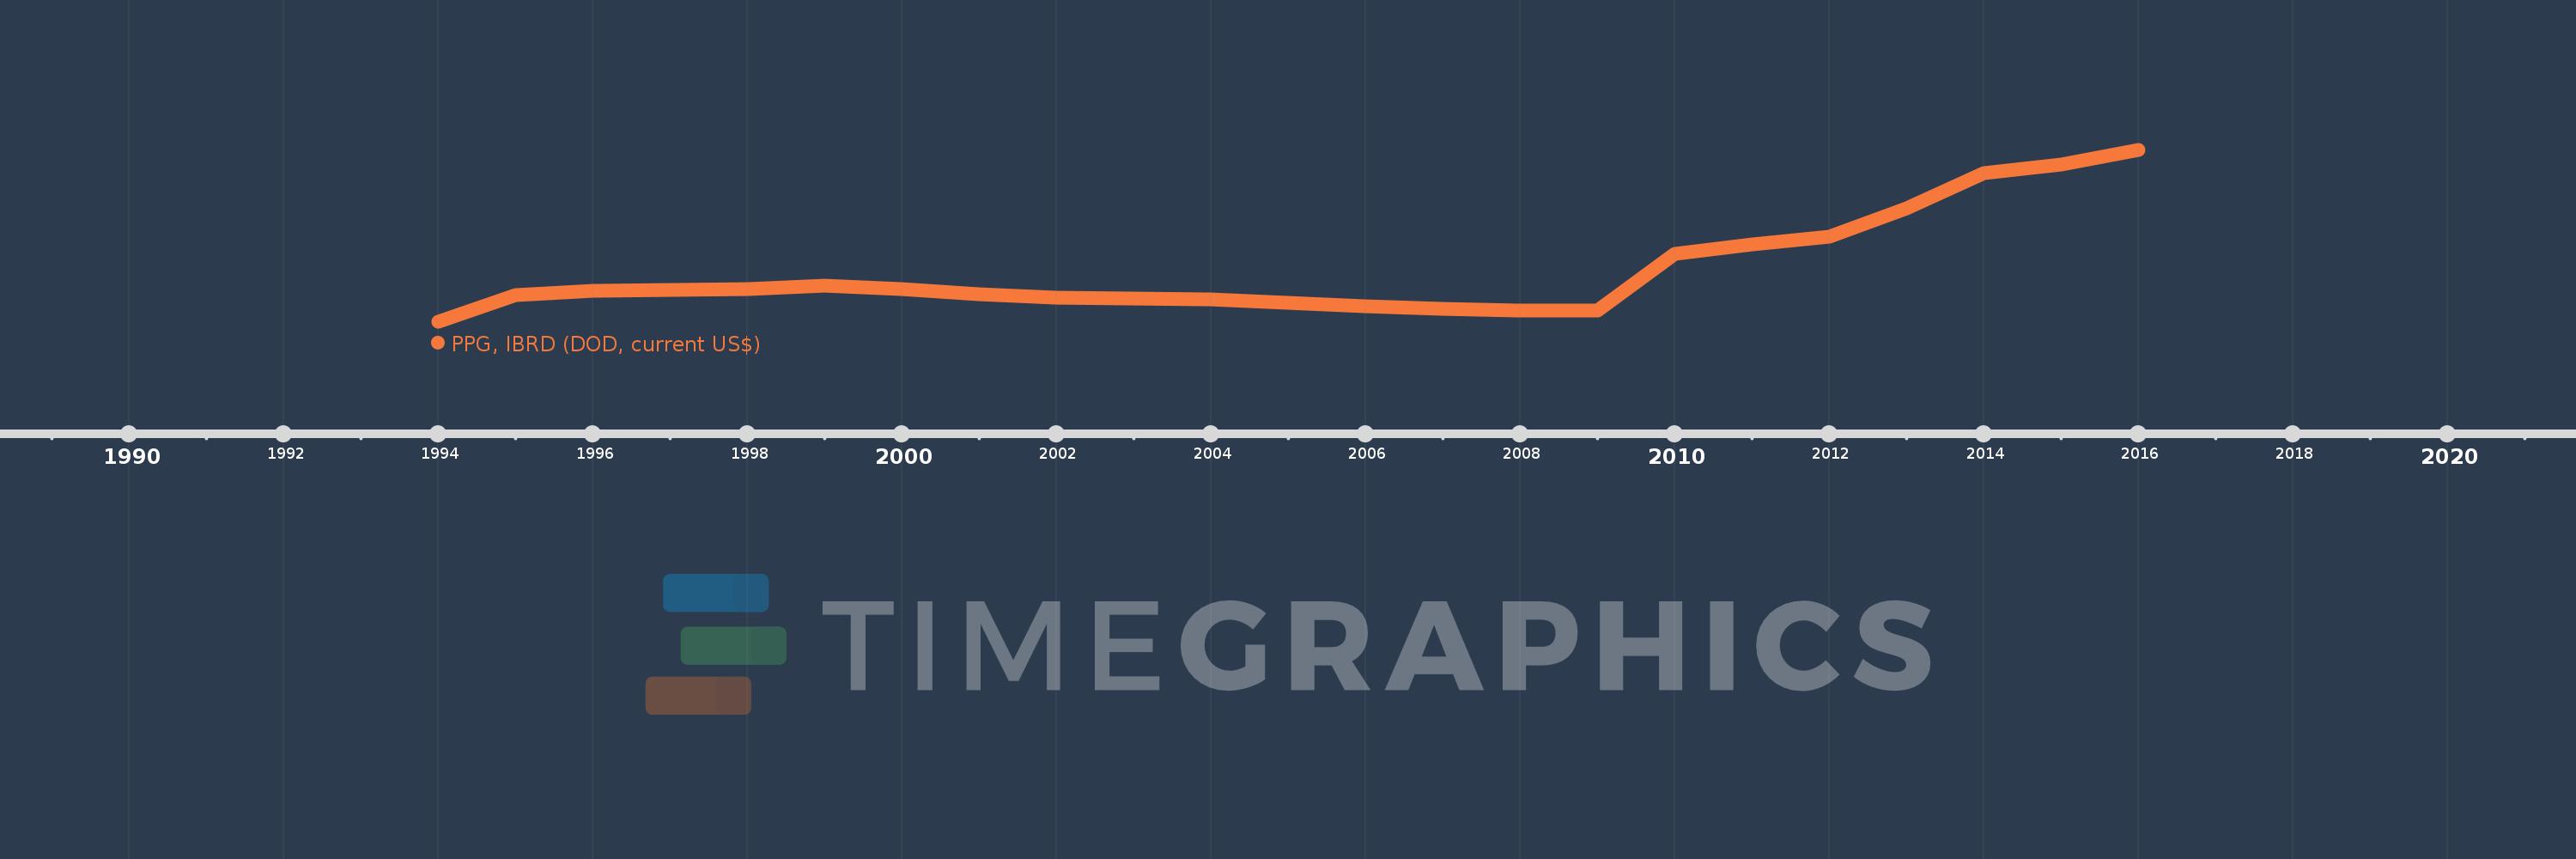
Timeline:
This timeline shows a graph from
1994
to
2016
of Belarus. No data until
1993
. Number of actual observations by date:
23
.
Source name:
World Development Indicators
Source organization:
World Bank, International Debt Statistics.
Categories, topics:
External Debt
Last updated:
apr 23, 2017
Indicators value changes by year
Meaning:
192.652 mln
Minimum:
100.0K
jan 1, 1994
Maximum:
641.812 mln
jan 1, 2016
At the date of observation
Value
Absolute change
Change from the previous value
jan 1, 1994
100.0K
+100.0K
0.0%
jan 1, 1995
101.043 mln
+100.943 mln
100.94K%
jan 1, 1996
115.533 mln
+14.49 mln
14.34%
jan 1, 1997
120.744 mln
+5.211 mln
4.51%
jan 1, 1998
123.754 mln
+3.01 mln
2.49%
jan 1, 1999
134.887 mln
+11.133 mln
9.0%
jan 1, 2000
122.328 mln
-12.559 mln
-9.31%
jan 1, 2001
105.154 mln
-17.174 mln
-14.04%
jan 1, 2002
91.369 mln
-13.785 mln
-13.11%
jan 1, 2003
89.247 mln
-2.122 mln
-2.32%
jan 1, 2004
83.684 mln
-5.563 mln
-6.23%
jan 1, 2005
73.031 mln
-10.653 mln
-12.73%
jan 1, 2006
58.67 mln
-14.361 mln
-19.66%
jan 1, 2007
49.7 mln
-8.97 mln
-15.29%
jan 1, 2008
42.311 mln
-7.389 mln
-14.87%
jan 1, 2009
42.321 mln
+10.0K
0.02%
jan 1, 2010
255.63 mln
+213.309 mln
504.03%
jan 1, 2011
291.336 mln
+35.706 mln
13.97%
jan 1, 2012
317.548 mln
+26.212 mln
9.0%
jan 1, 2013
424.328 mln
+106.78 mln
33.63%
jan 1, 2014
556.657 mln
+132.329 mln
31.19%
jan 1, 2015
589.814 mln
+33.157 mln
5.96%
jan 1, 2016
641.812 mln
+51.998 mln
8.82%
Ranking of countries by current statistics by years
About & Feedback
Terms
Privacy
FAQ
Support 24/7
Cabinet
Get premium
Donate
The service accepts bank transfer (ACH, Wire) or cards (Visa, MasterCard, etc). Processed by Stripe.
Secured with SSL