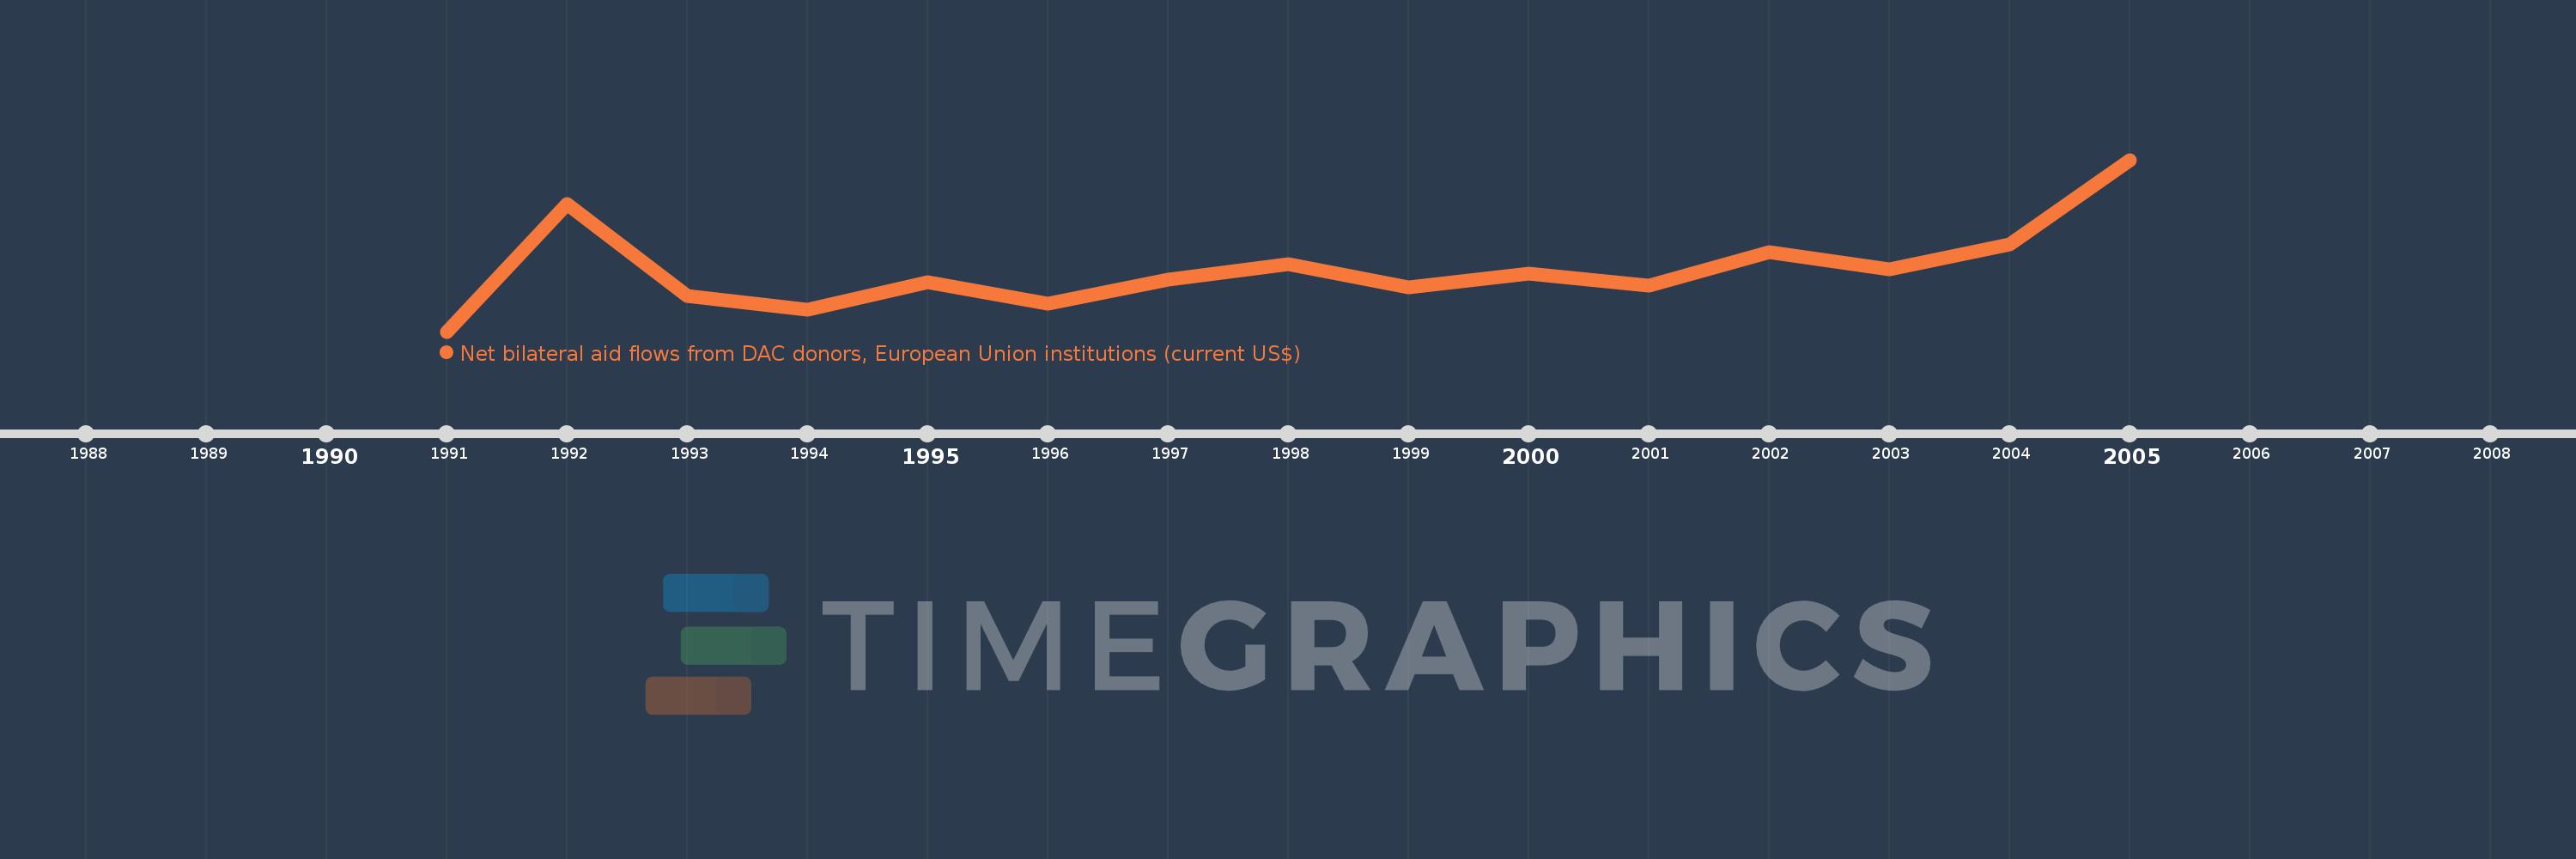
This timeline shows a graph from 1991 to 2005 of Bulgaria. No data until 1990. Number of actual observations by date: 15.
Source name:
World Development Indicators
Source organization:
Development Assistance Committee of the Organisation for Economic Co-operation and Development, Geographical Distribution of Financial Flows to Developing Countries, Development Co-operation Report, and International Development Statistics database. Data are available online at: www.oecd.org/dac/stats/idsonline.
Categories, topics:
Aid Effectiveness
Last updated:
apr 23, 2017
Indicators value changes by year
Meaning:
128.68 mln
Minimum:
890.0K
jan 1, 1991
Maximum:
354.67 mln
jan 1, 2005
At the date of observation
Value
Absolute change
Change from the previous value
jan 1, 1991
890.0K
+890.0K
0.0%
jan 1, 1992
263.12 mln
+262.23 mln
29.46K%
jan 1, 1993
73.89 mln
-189.23 mln
-71.92%
jan 1, 1994
46.02 mln
-27.87 mln
-37.72%
jan 1, 1995
102.76 mln
+56.74 mln
123.29%
jan 1, 1996
58.15 mln
-44.61 mln
-43.41%
jan 1, 1997
107.21 mln
+49.06 mln
84.37%
jan 1, 1998
140.09 mln
+32.88 mln
30.67%
jan 1, 1999
92.8 mln
-47.29 mln
-33.76%
jan 1, 2000
120.97 mln
+28.17 mln
30.36%
jan 1, 2001
95.34 mln
-25.63 mln
-21.19%
jan 1, 2002
165.04 mln
+69.7 mln
73.11%
jan 1, 2003
129.3 mln
-35.74 mln
-21.66%
jan 1, 2004
179.95 mln
+50.65 mln
39.17%
jan 1, 2005
354.67 mln
+174.72 mln
97.09%
Ranking of countries by current statistics by years