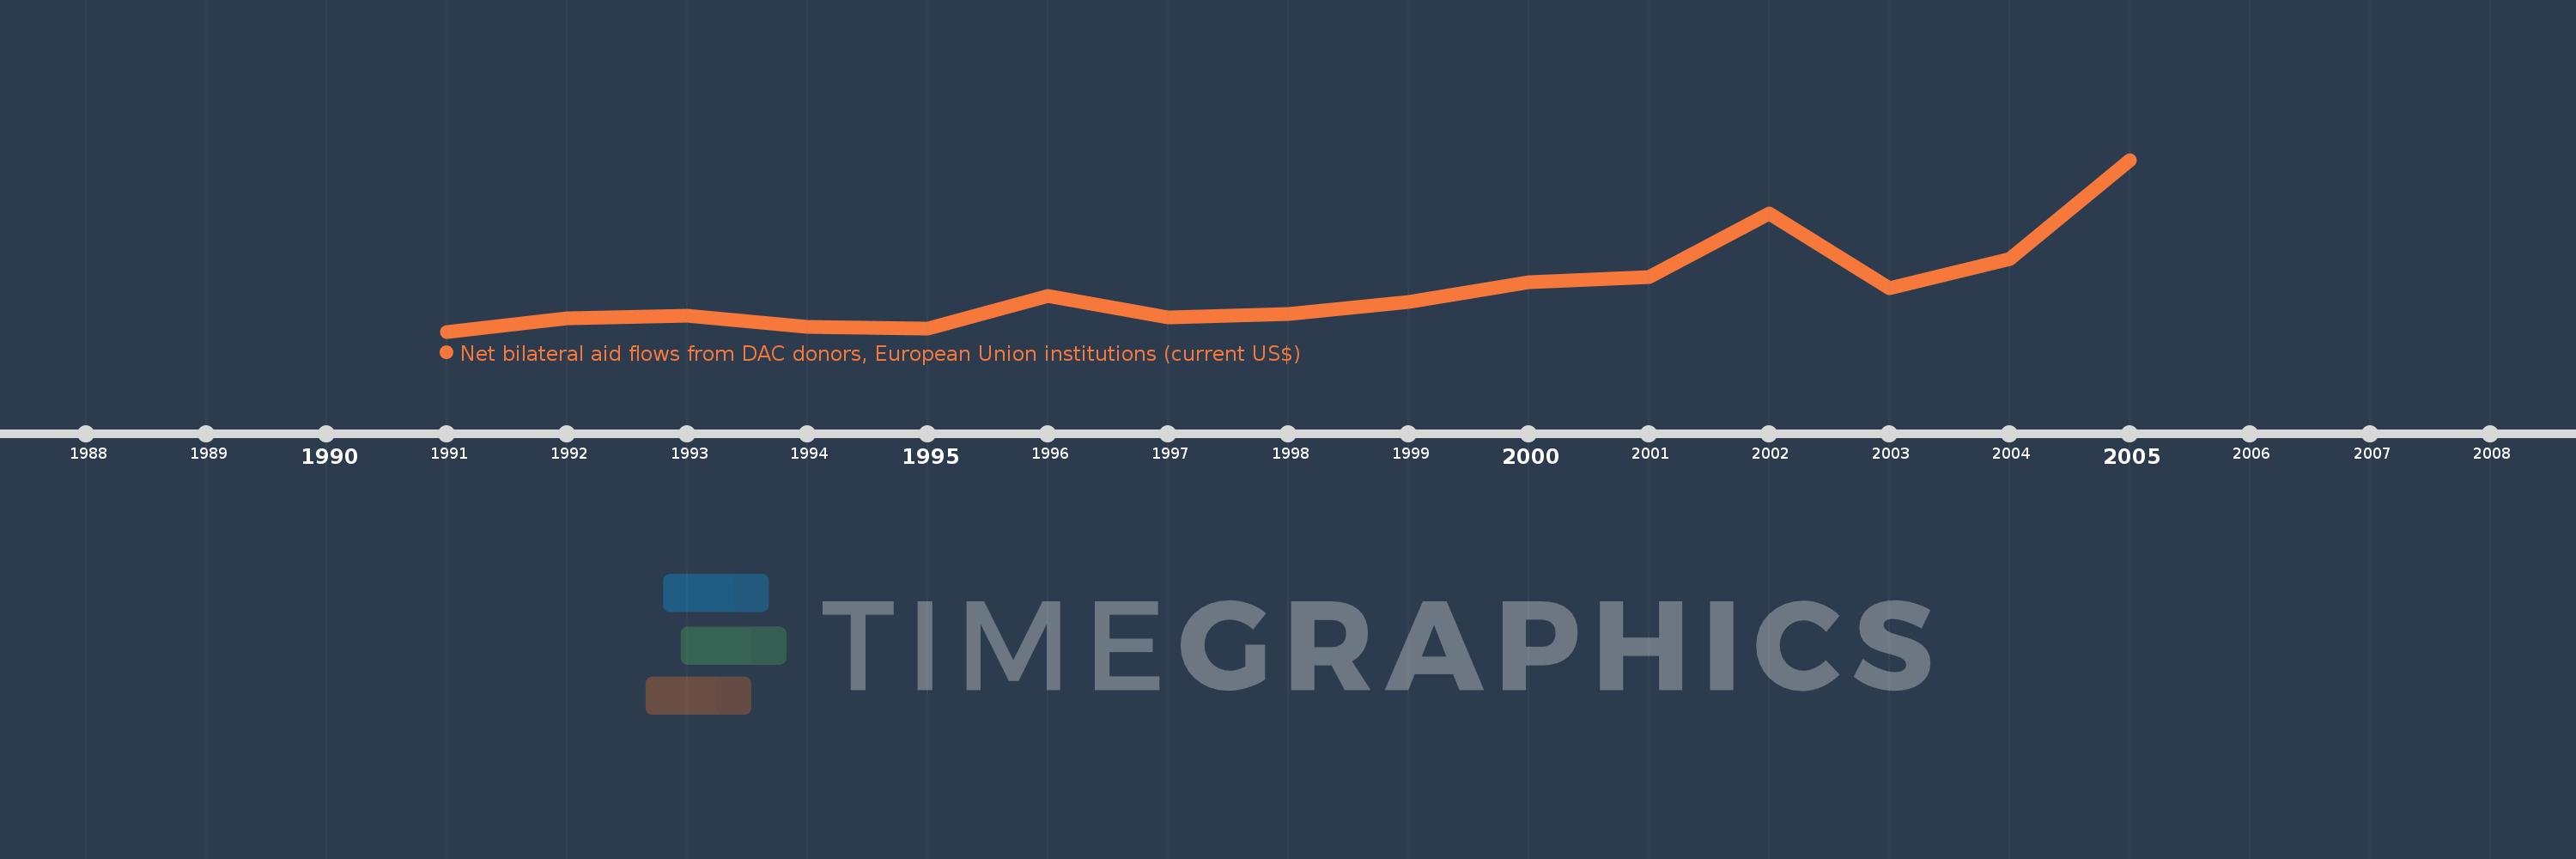
This timeline shows a graph from 1991 to 2005 of Romania. No data until 1990. Number of actual observations by date: 15.
Source name:
World Development Indicators
Source organization:
Development Assistance Committee of the Organisation for Economic Co-operation and Development, Geographical Distribution of Financial Flows to Developing Countries, Development Co-operation Report, and International Development Statistics database. Data are available online at: www.oecd.org/dac/stats/idsonline.
Categories, topics:
Aid Effectiveness
Last updated:
apr 23, 2017
Indicators value changes by year
Meaning:
220.023 mln
Minimum:
61.85 mln
jan 1, 1991
Maximum:
694.8 mln
jan 1, 2005
At the date of observation
Value
Absolute change
Change from the previous value
jan 1, 1991
61.85 mln
+61.85 mln
0.0%
jan 1, 1992
112.1 mln
+50.25 mln
81.24%
jan 1, 1993
119.23 mln
+7.13 mln
6.36%
jan 1, 1994
78.45 mln
-40.78 mln
-34.2%
jan 1, 1995
74.18 mln
-4.27 mln
-5.44%
jan 1, 1996
193.87 mln
+119.69 mln
161.35%
jan 1, 1997
112.63 mln
-81.24 mln
-41.9%
jan 1, 1998
125.37 mln
+12.74 mln
11.31%
jan 1, 1999
172.61 mln
+47.24 mln
37.68%
jan 1, 2000
243.7 mln
+71.09 mln
41.19%
jan 1, 2001
264.17 mln
+20.47 mln
8.4%
jan 1, 2002
497.07 mln
+232.9 mln
88.16%
jan 1, 2003
220.26 mln
-276.81 mln
-55.69%
jan 1, 2004
330.05 mln
+109.79 mln
49.85%
jan 1, 2005
694.8 mln
+364.75 mln
110.51%
Ranking of countries by current statistics by years