33
/
AIzaSyB4mHJ5NPEv-XzF7P6NDYXjlkCWaeKw5bc
November 30, 2025
271193
Turks and Caicos Islands
TCA
true
2
1
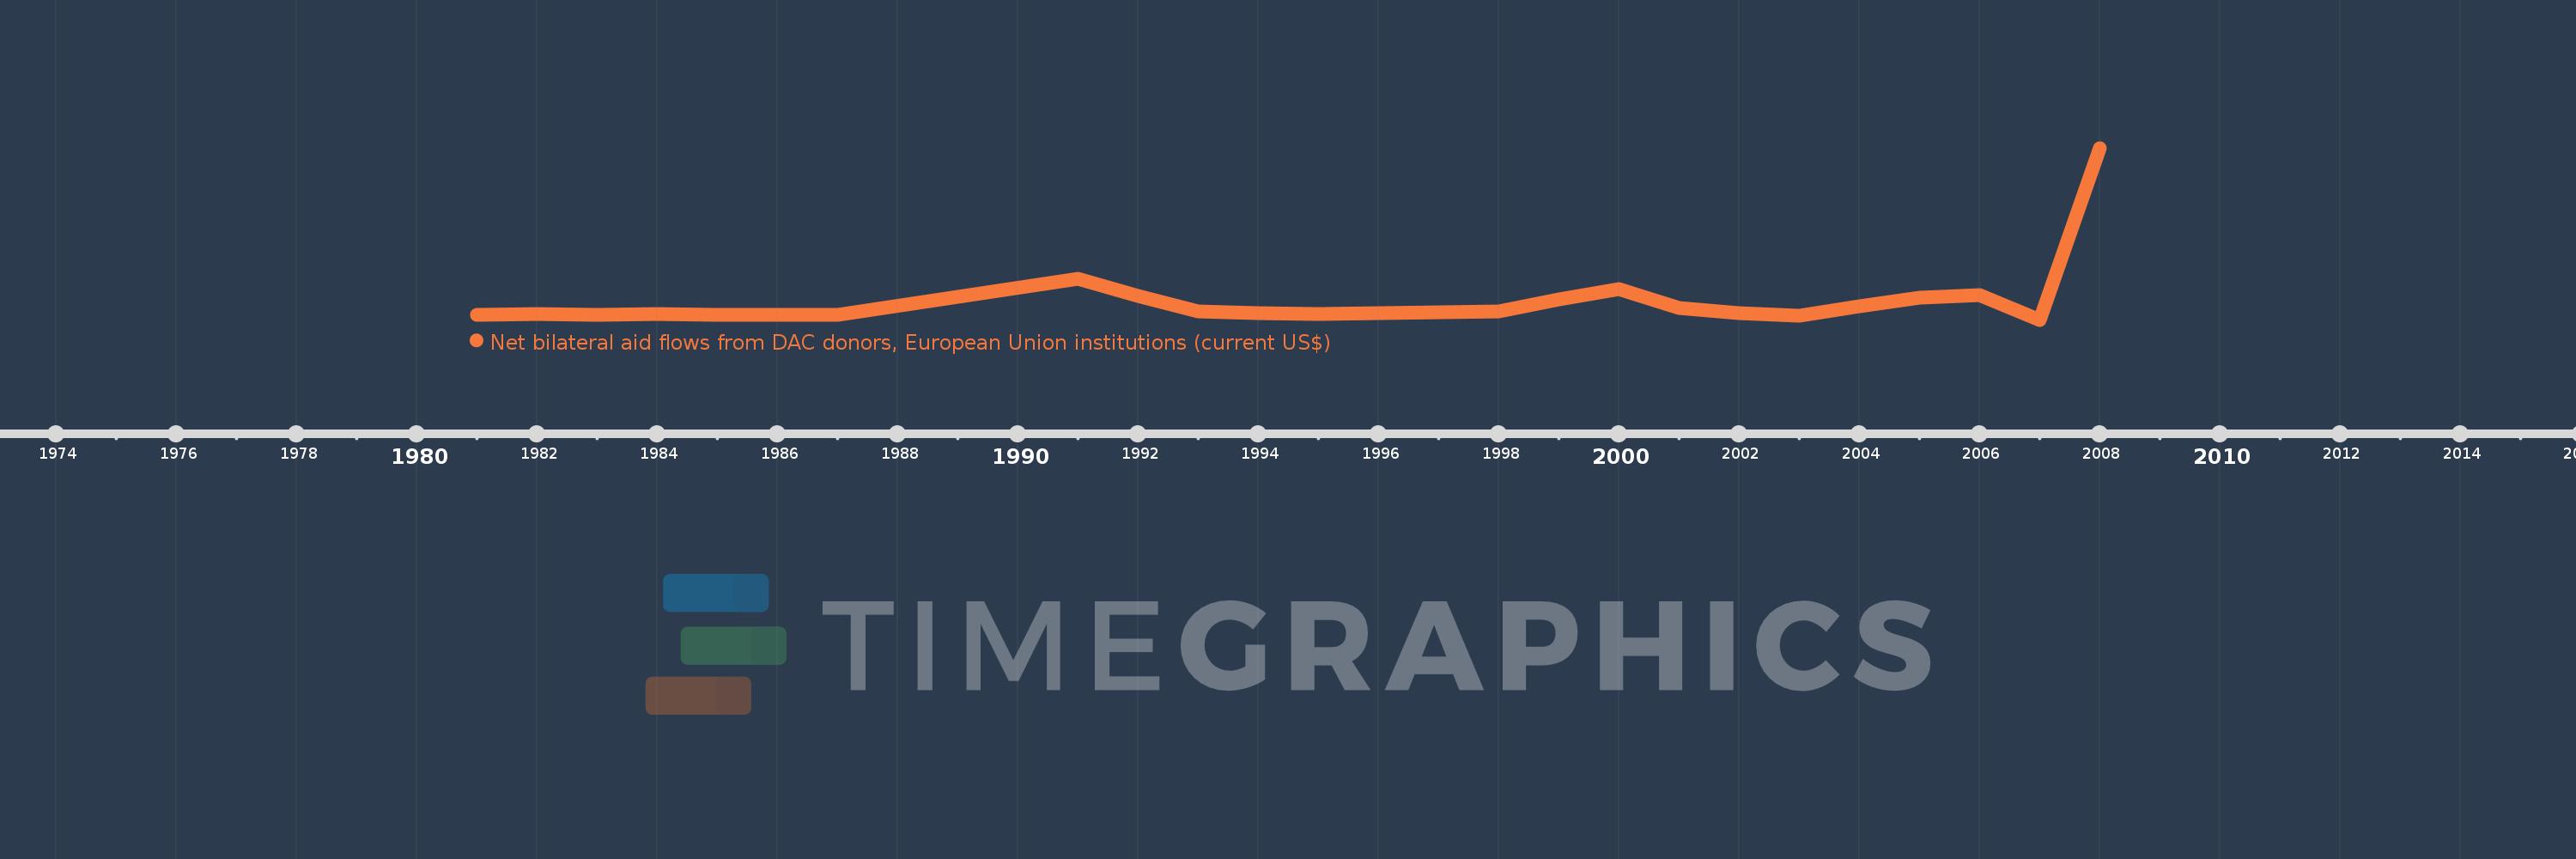
Net bilateral aid flows from DAC donors, European Union institutions (current US$)
2008,2007,2006,2005,2004,2003,2002,2001,2000,1999,1998,1997,1995,1994,1993,1992,1991,1987,1986,1985,1984,1983,1982,1981