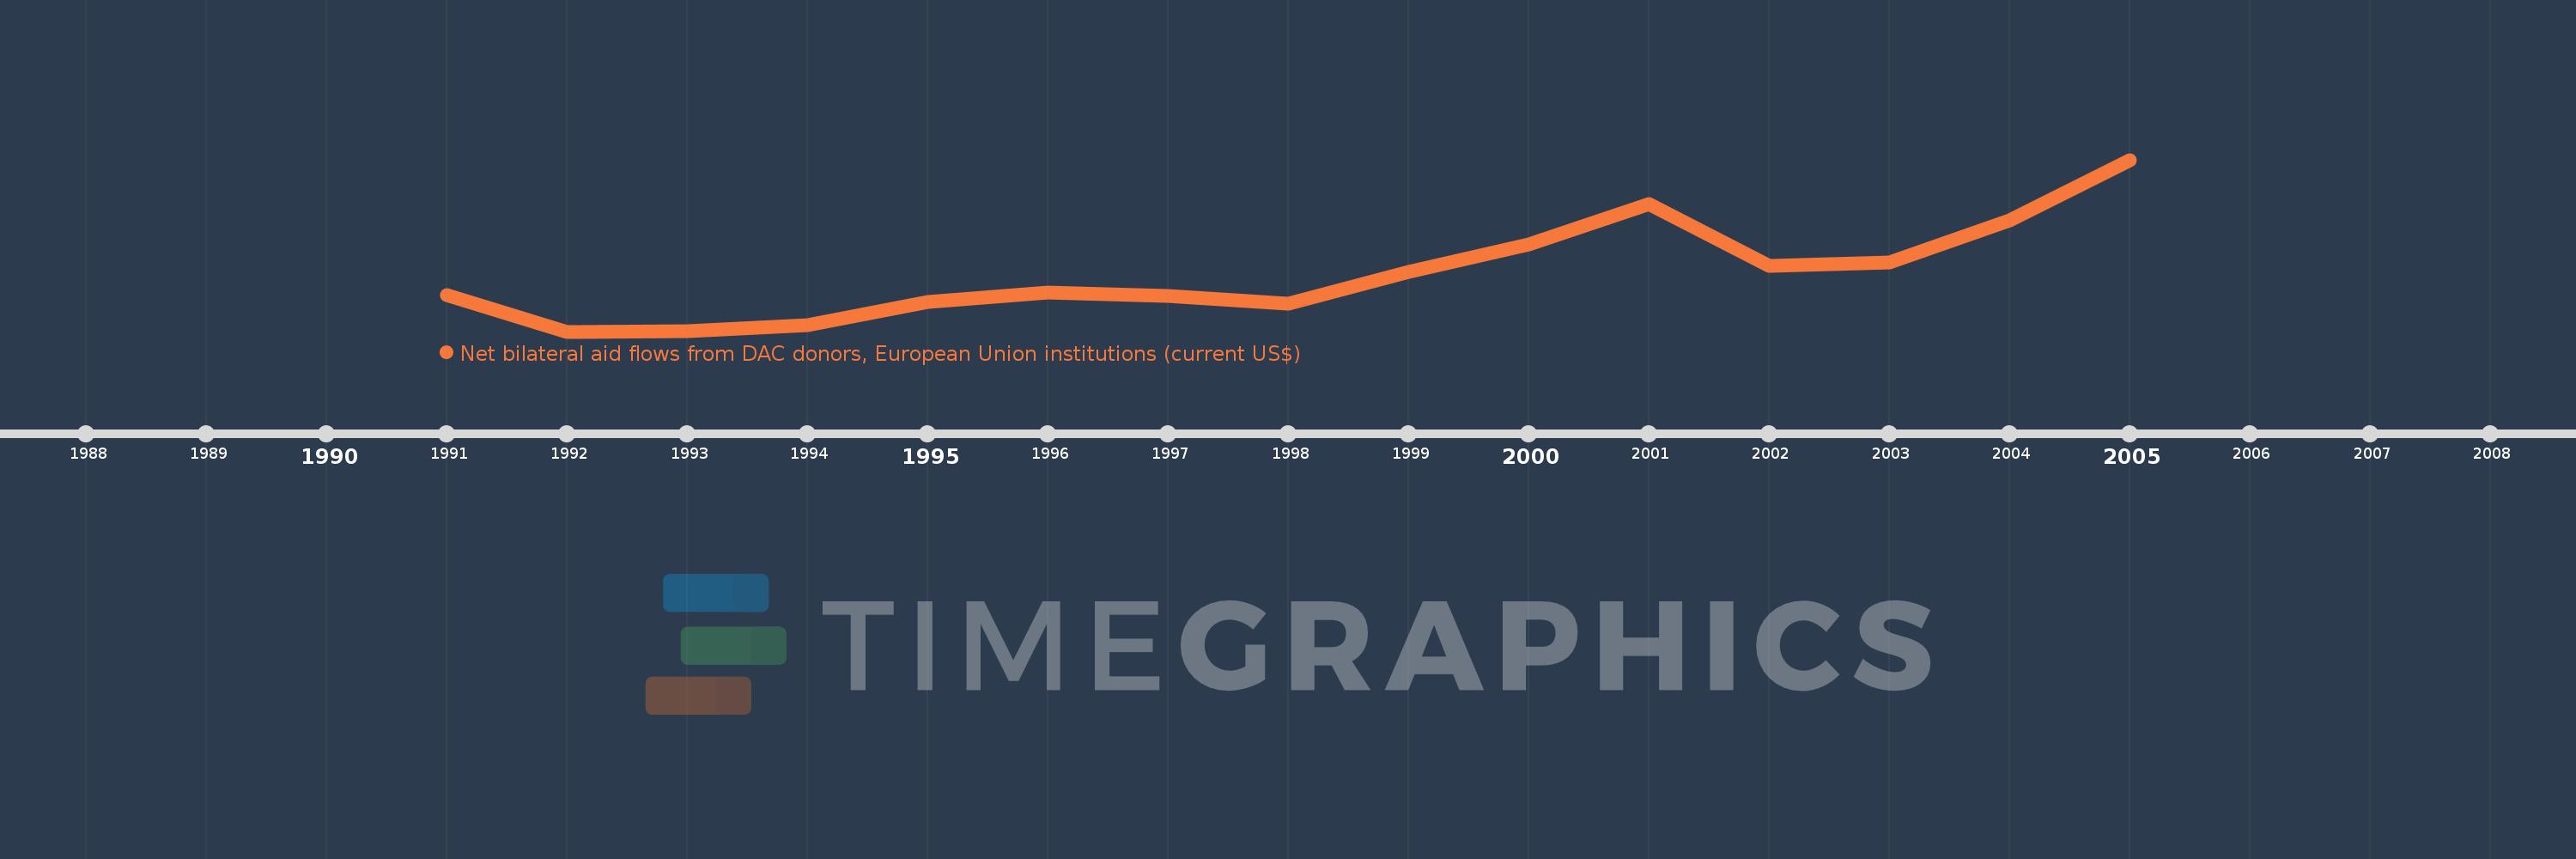
This timeline shows a graph from 1991 to 2005 of Poland. No data until 1990. Number of actual observations by date: 15.
Source name:
World Development Indicators
Source organization:
Development Assistance Committee of the Organisation for Economic Co-operation and Development, Geographical Distribution of Financial Flows to Developing Countries, Development Co-operation Report, and International Development Statistics database. Data are available online at: www.oecd.org/dac/stats/idsonline.
Categories, topics:
Aid Effectiveness
Last updated:
apr 23, 2017
Indicators value changes by year
Meaning:
417.143 mln
Minimum:
69.81 mln
jan 1, 1992
Maximum:
1.101 bln
jan 1, 2005
At the date of observation
Value
Absolute change
Change from the previous value
jan 1, 1991
288.63 mln
+288.63 mln
0.0%
jan 1, 1992
69.81 mln
-218.82 mln
-75.81%
jan 1, 1993
74.59 mln
+4.78 mln
6.85%
jan 1, 1994
108.58 mln
+33.99 mln
45.57%
jan 1, 1995
247.98 mln
+139.4 mln
128.38%
jan 1, 1996
306.17 mln
+58.19 mln
23.47%
jan 1, 1997
281.64 mln
-24.53 mln
-8.01%
jan 1, 1998
234.82 mln
-46.82 mln
-16.62%
jan 1, 1999
426.83 mln
+192.01 mln
81.77%
jan 1, 2000
592.91 mln
+166.08 mln
38.91%
jan 1, 2001
837.85 mln
+244.94 mln
41.31%
jan 1, 2002
464.61 mln
-373.24 mln
-44.55%
jan 1, 2003
483.03 mln
+18.42 mln
3.96%
jan 1, 2004
738.66 mln
+255.63 mln
52.92%
jan 1, 2005
1.101 bln
+362.37 mln
49.06%
Ranking of countries by current statistics by years