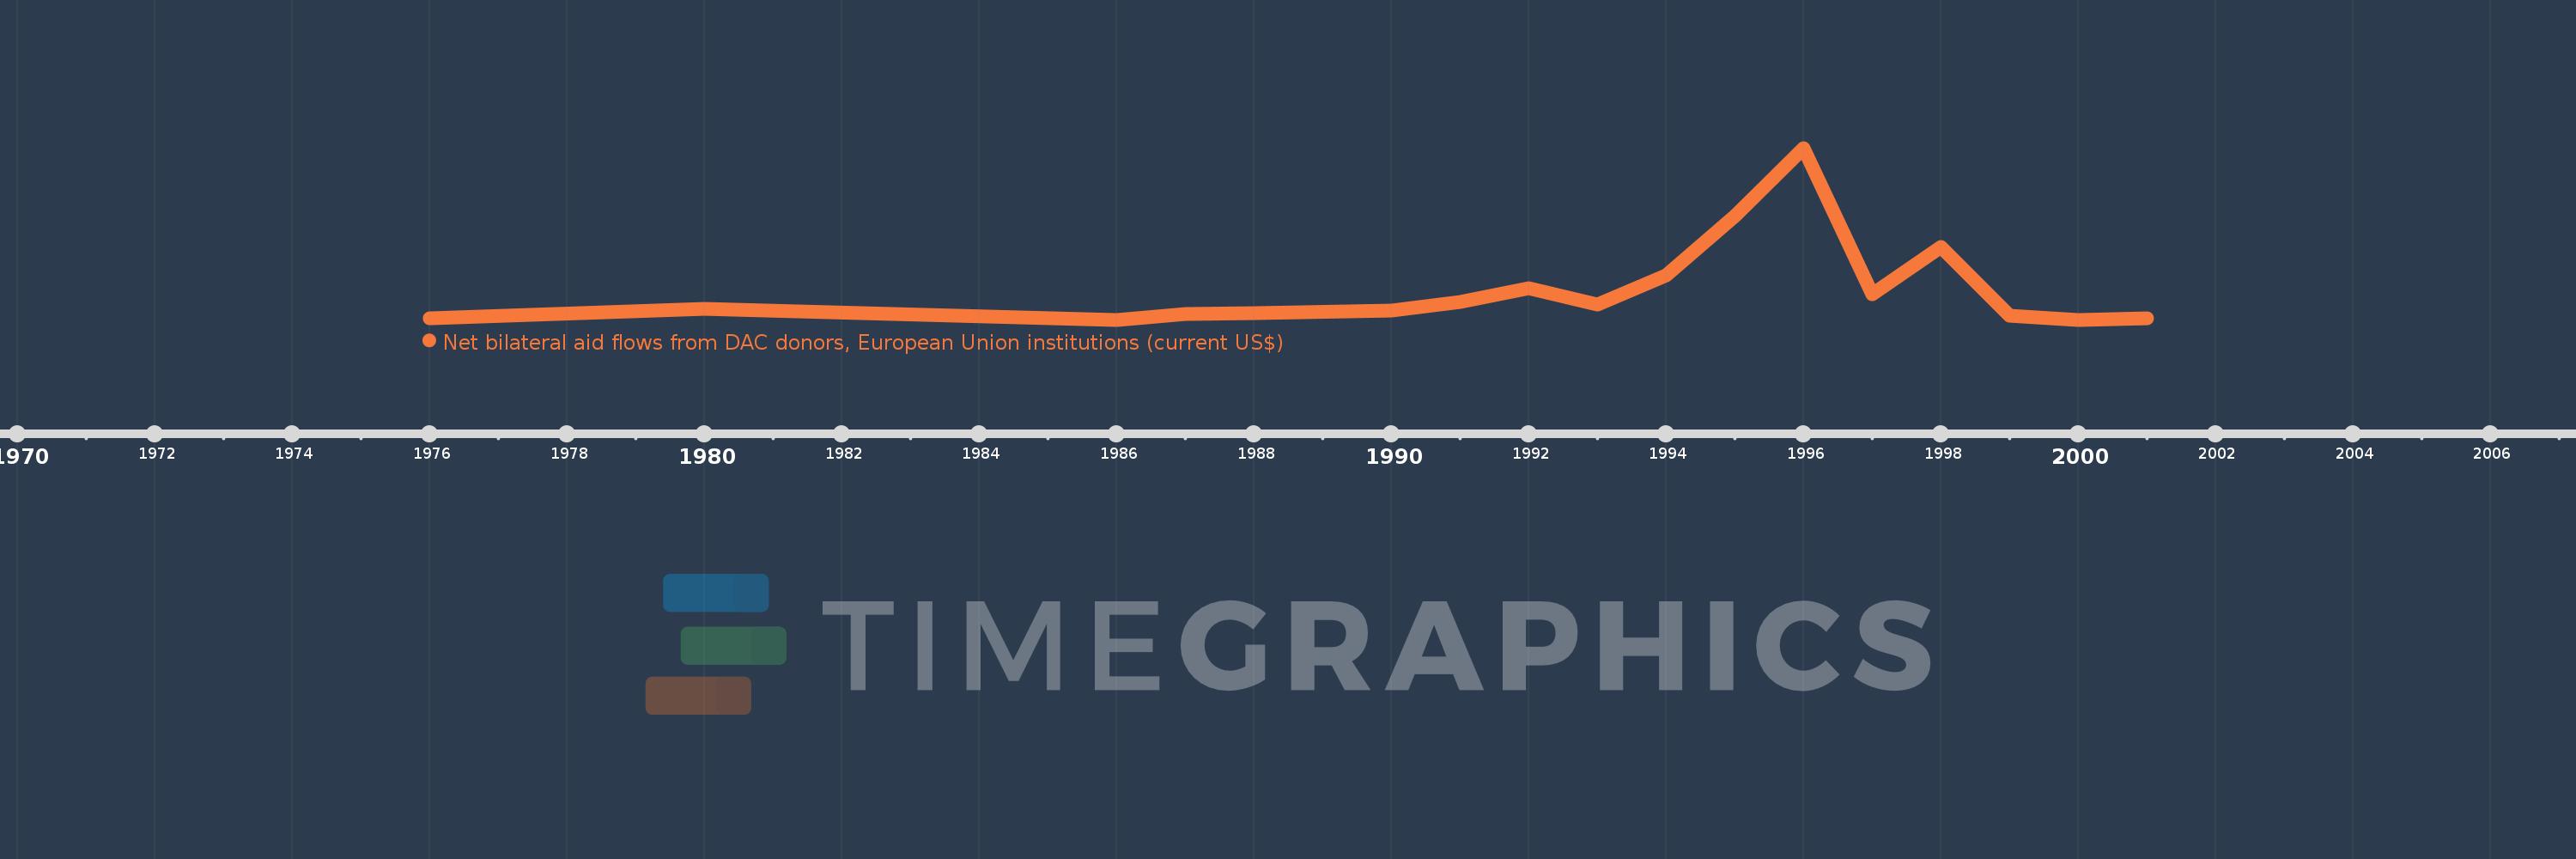
This timeline shows a graph from 1976 to 2001 of Singapore. No data until 1975. Number of actual observations by date: 17.
Source name:
World Development Indicators
Source organization:
Development Assistance Committee of the Organisation for Economic Co-operation and Development, Geographical Distribution of Financial Flows to Developing Countries, Development Co-operation Report, and International Development Statistics database. Data are available online at: www.oecd.org/dac/stats/idsonline.
Categories, topics:
Aid Effectiveness
Last updated:
apr 23, 2017
Indicators value changes by year
Meaning:
342.353K
Minimum:
10.0K
jan 1, 1986
Maximum:
1.87 mln
jan 1, 1996
At the date of observation
Value
Absolute change
Change from the previous value
jan 1, 1976
30.0K
+30.0K
0.0%
jan 1, 1980
130.0K
+100.0K
333.33%
jan 1, 1986
10.0K
-120.0K
-92.31%
jan 1, 1987
70.0K
+60.0K
600.0%
jan 1, 1988
80.0K
+10.0K
14.29%
jan 1, 1990
110.0K
+30.0K
37.5%
jan 1, 1991
200.0K
+90.0K
81.82%
jan 1, 1992
350.0K
+150.0K
75.0%
jan 1, 1993
170.0K
-180.0K
-51.43%
jan 1, 1994
490.0K
+320.0K
188.24%
jan 1, 1995
1.13 mln
+640.0K
130.61%
jan 1, 1996
1.87 mln
+740.0K
65.49%
jan 1, 1997
290.0K
-1.58 mln
-84.49%
jan 1, 1998
800.0K
+510.0K
175.86%
jan 1, 1999
50.0K
-750.0K
-93.75%
jan 1, 2000
10.0K
-40.0K
-80.0%
jan 1, 2001
30.0K
+20.0K
200.0%
Ranking of countries by current statistics by years