33
/
AIzaSyB4mHJ5NPEv-XzF7P6NDYXjlkCWaeKw5bc
November 30, 2025
93014
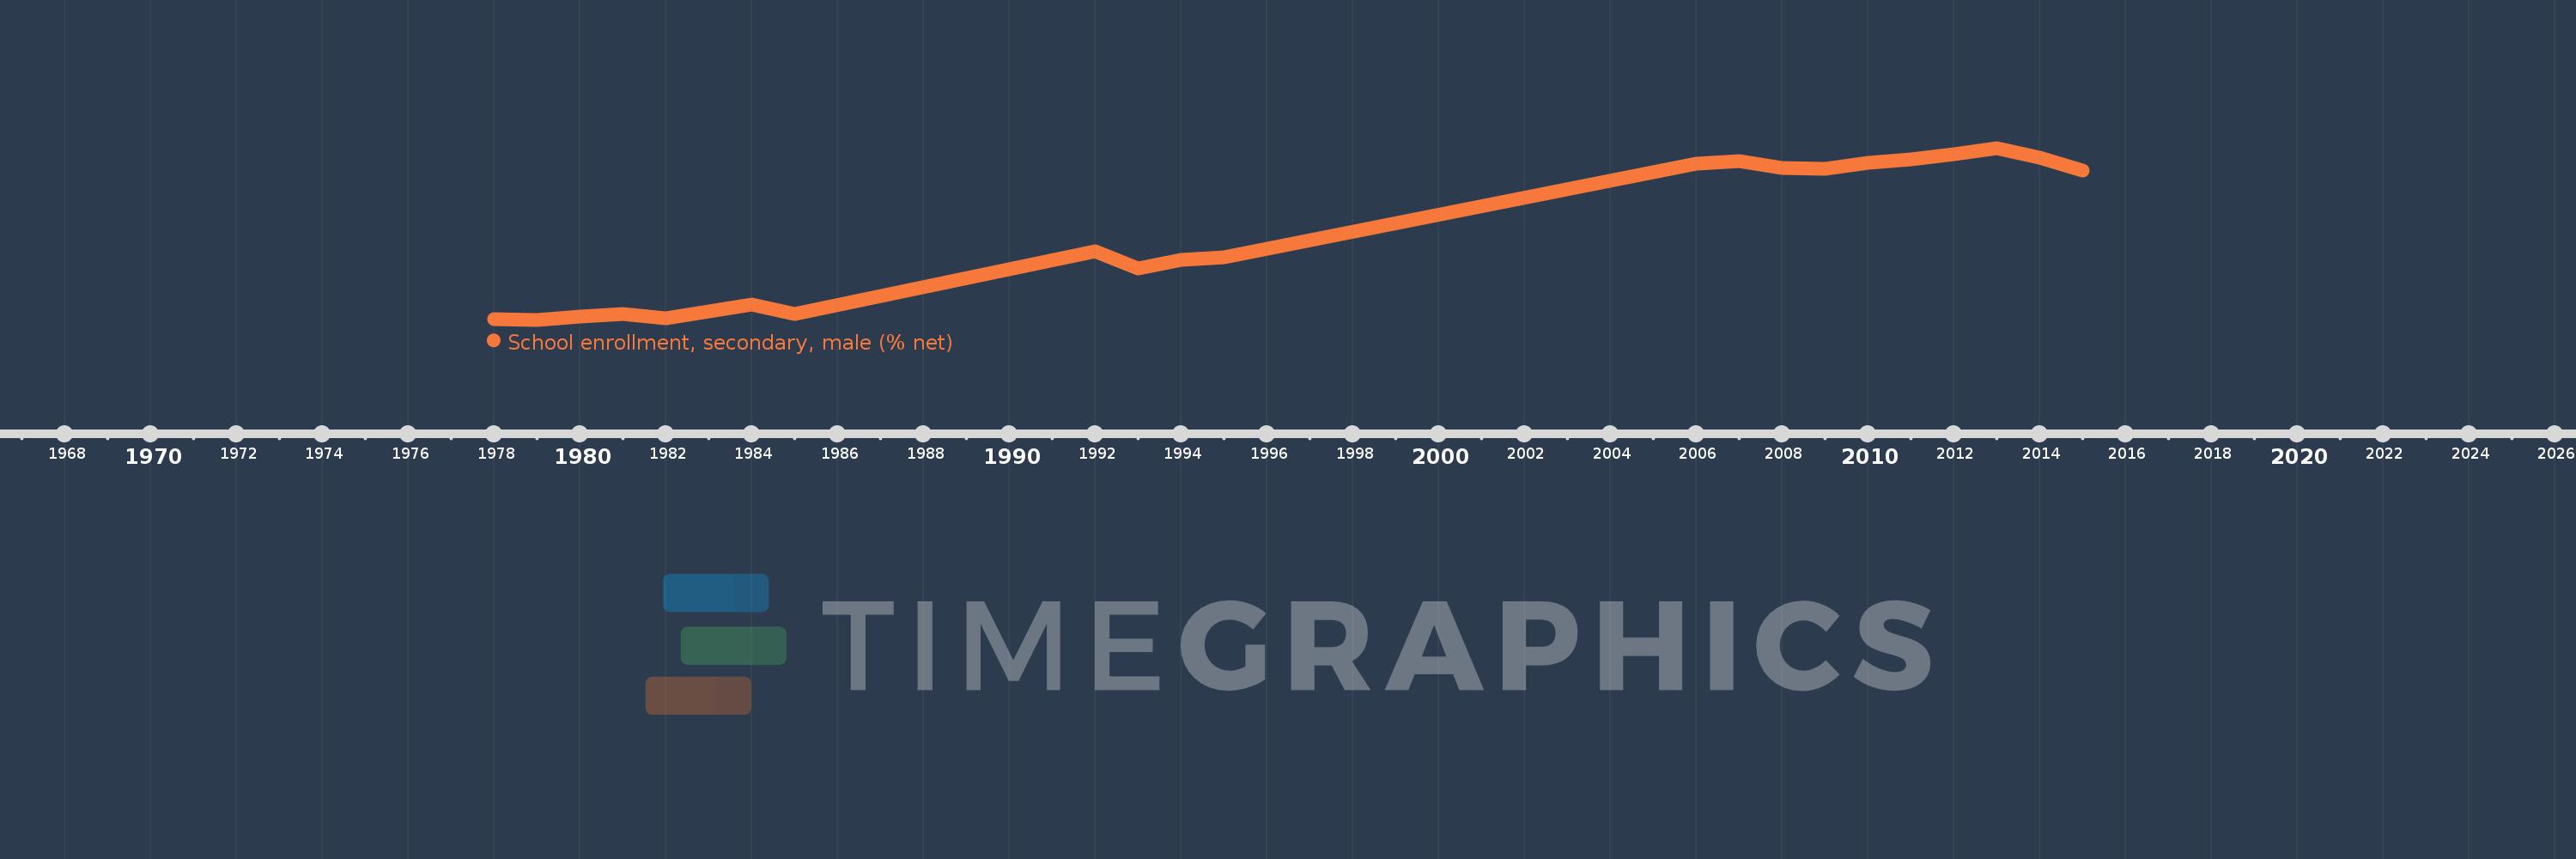
Brunei Darussalam
BRN
true
2
1
School enrollment, secondary, male (% net)
2015,2014,2013,2012,2011,2010,2009,2008,2007,2006,1995,1994,1993,1992,1985,1984,1983,1982,1981,1980,1979,1978