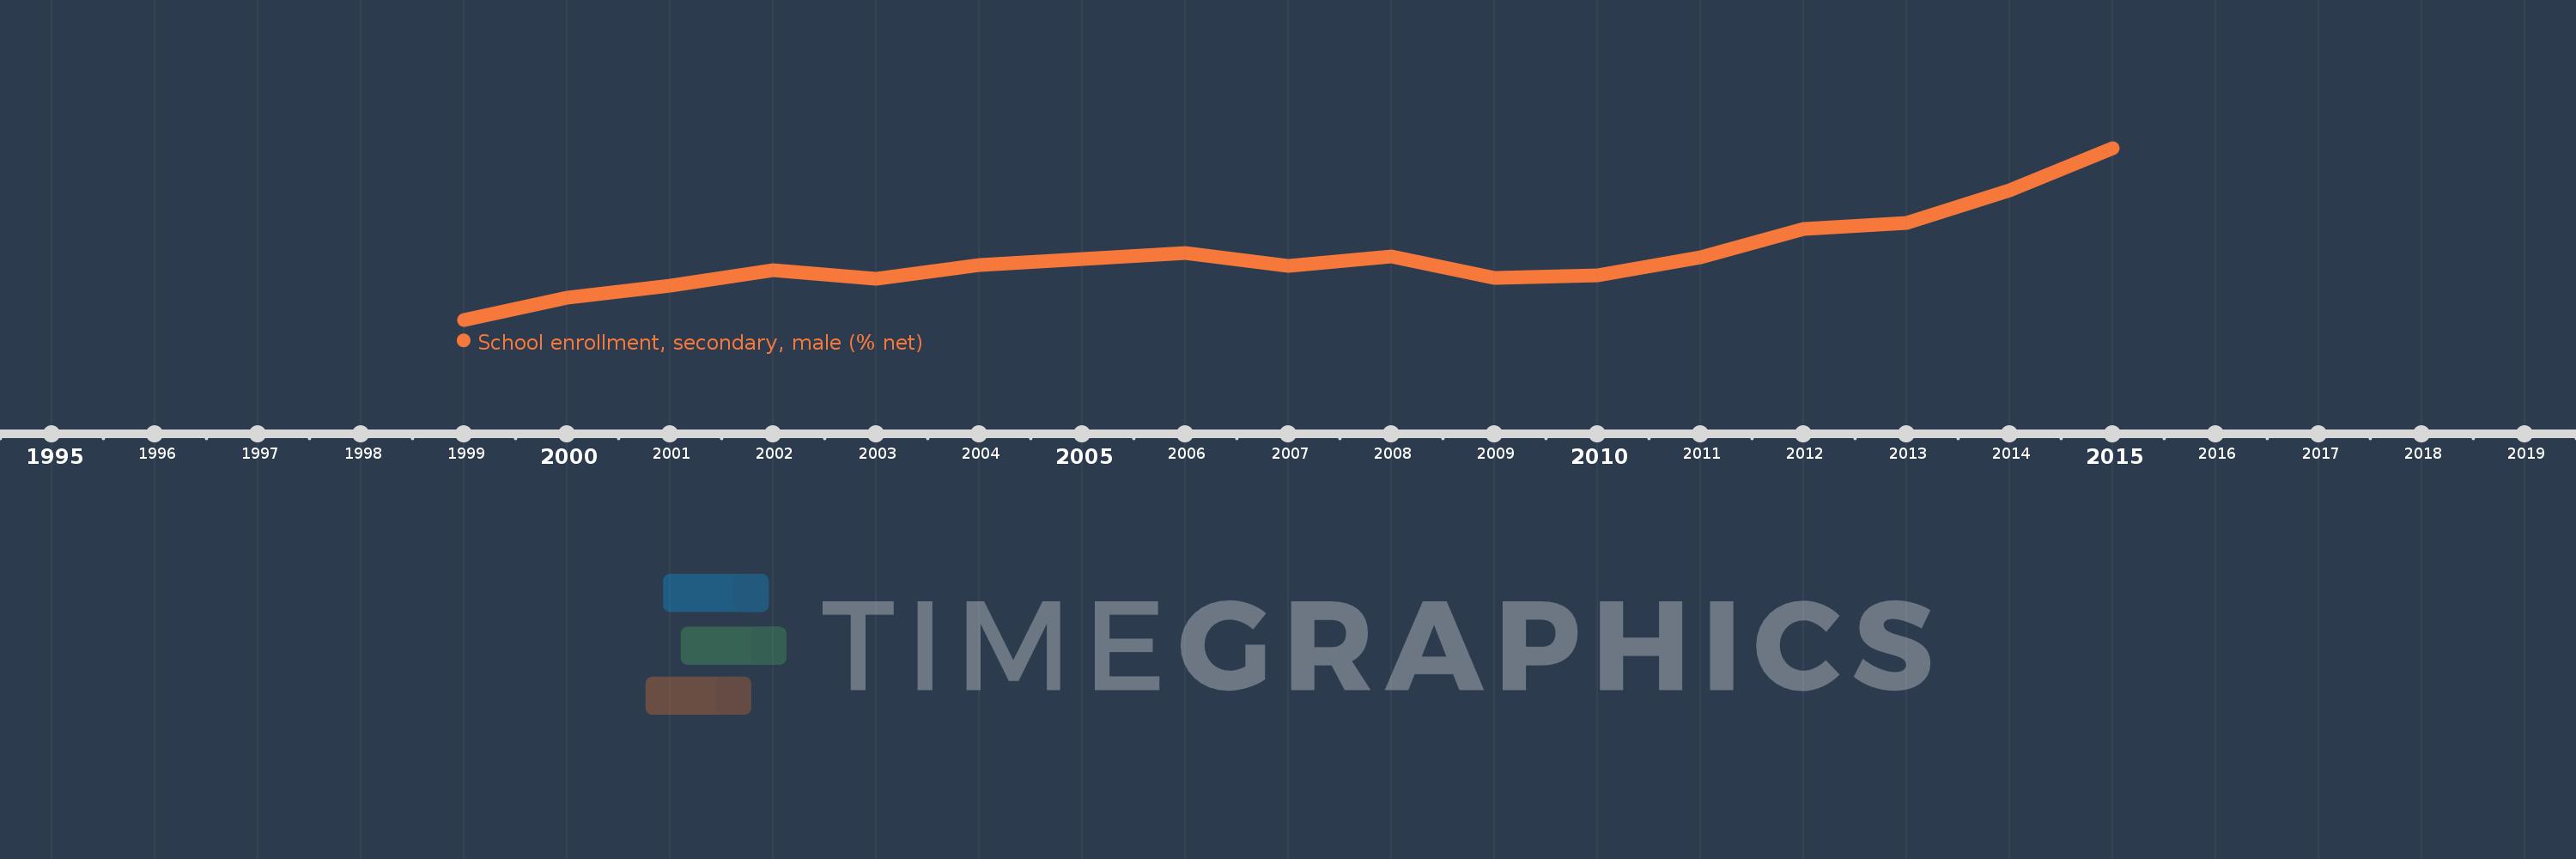
This timeline shows a graph from 1999 to 2015 of East Asia & Pacific (IDA & IBRD countries). No data until 1998. Number of actual observations by date: 16.
Source name:
World Development Indicators
Source organization:
United Nations Educational, Scientific, and Cultural Organization (UNESCO) Institute for Statistics.
Categories, topics:
Education, Gender
Last updated:
apr 23, 2017
Indicators value changes by year
Meaning:
67.082
Minimum:
63.211
jan 1, 1999
Maximum:
73.614
jan 1, 2015
At the date of observation
Value
Absolute change
Change from the previous value
jan 1, 1999
63.211
+63.211
0.0%
jan 1, 2000
64.538
+1.327
2.1%
jan 1, 2001
65.271
+0.733
1.14%
jan 1, 2002
66.2
+0.929
1.42%
jan 1, 2003
65.675
-0.524
-0.79%
jan 1, 2004
66.53
+0.855
1.3%
jan 1, 2006
67.276
+0.746
1.12%
jan 1, 2007
66.489
-0.787
-1.17%
jan 1, 2008
67.042
+0.554
0.83%
jan 1, 2009
65.76
-1.283
-1.91%
jan 1, 2010
65.888
+0.128
0.19%
jan 1, 2011
66.997
+1.109
1.68%
jan 1, 2012
68.687
+1.69
2.52%
jan 1, 2013
69.094
+0.406
0.59%
jan 1, 2014
71.047
+1.953
2.83%
jan 1, 2015
73.614
+2.567
3.61%
Ranking of countries by current statistics by years