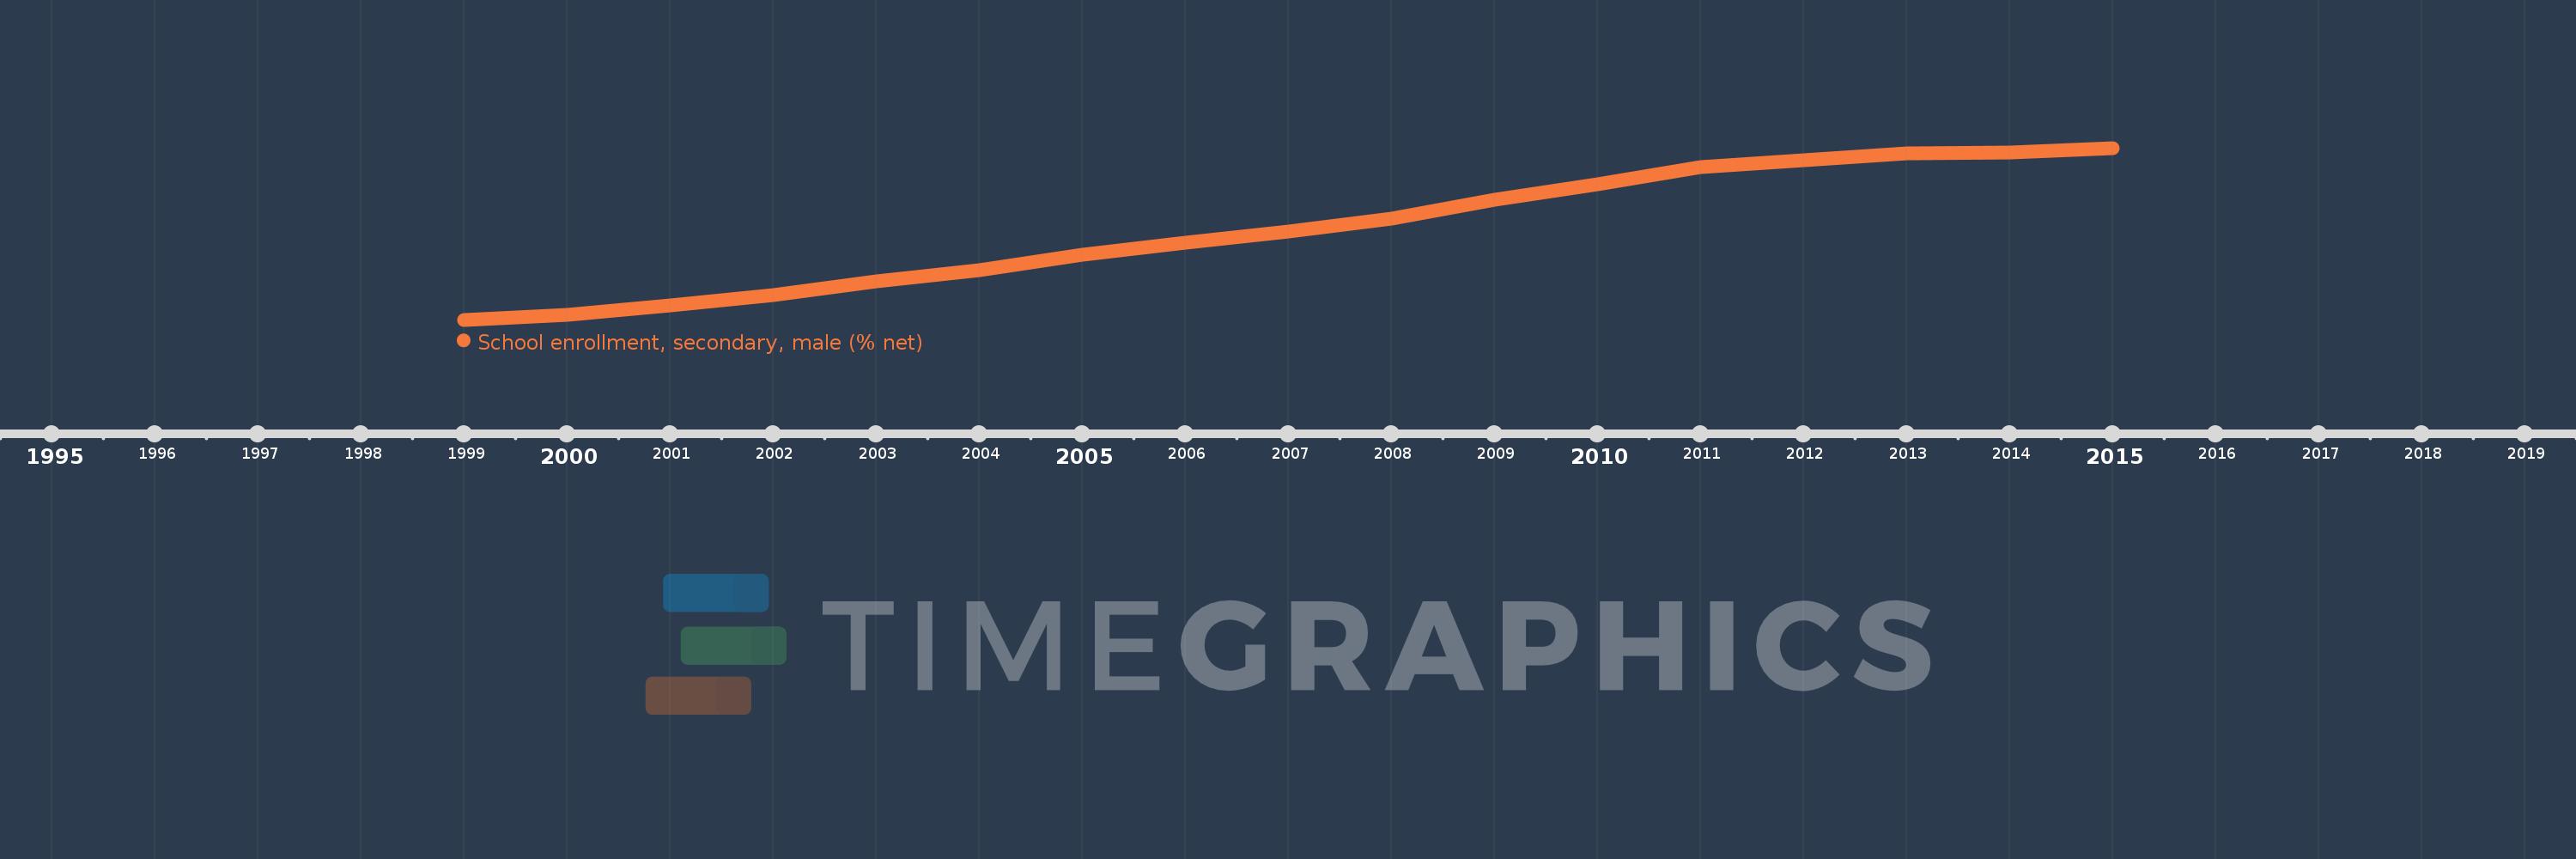
This timeline shows a graph from 1999 to 2015 of Sub-Saharan Africa (IDA & IBRD countries). No data until 1998. Number of actual observations by date: 17.
Source name:
World Development Indicators
Source organization:
United Nations Educational, Scientific, and Cultural Organization (UNESCO) Institute for Statistics.
Categories, topics:
Education, Gender
Last updated:
apr 23, 2017
Indicators value changes by year
Meaning:
28.728
Minimum:
21.354
jan 1, 1999
Maximum:
35.379
jan 1, 2015
At the date of observation
Value
Absolute change
Change from the previous value
jan 1, 1999
21.354
+21.354
0.0%
jan 1, 2000
21.732
+0.378
1.77%
jan 1, 2001
22.522
+0.79
3.64%
jan 1, 2002
23.38
+0.857
3.81%
jan 1, 2003
24.454
+1.074
4.6%
jan 1, 2004
25.394
+0.939
3.84%
jan 1, 2005
26.684
+1.291
5.08%
jan 1, 2006
27.651
+0.967
3.62%
jan 1, 2007
28.54
+0.889
3.21%
jan 1, 2008
29.588
+1.048
3.67%
jan 1, 2009
31.145
+1.557
5.26%
jan 1, 2010
32.397
+1.252
4.02%
jan 1, 2011
33.817
+1.42
4.38%
jan 1, 2012
34.406
+0.589
1.74%
jan 1, 2013
34.935
+0.529
1.54%
jan 1, 2014
34.998
+0.063
0.18%
jan 1, 2015
35.379
+0.381
1.09%
Ranking of countries by current statistics by years