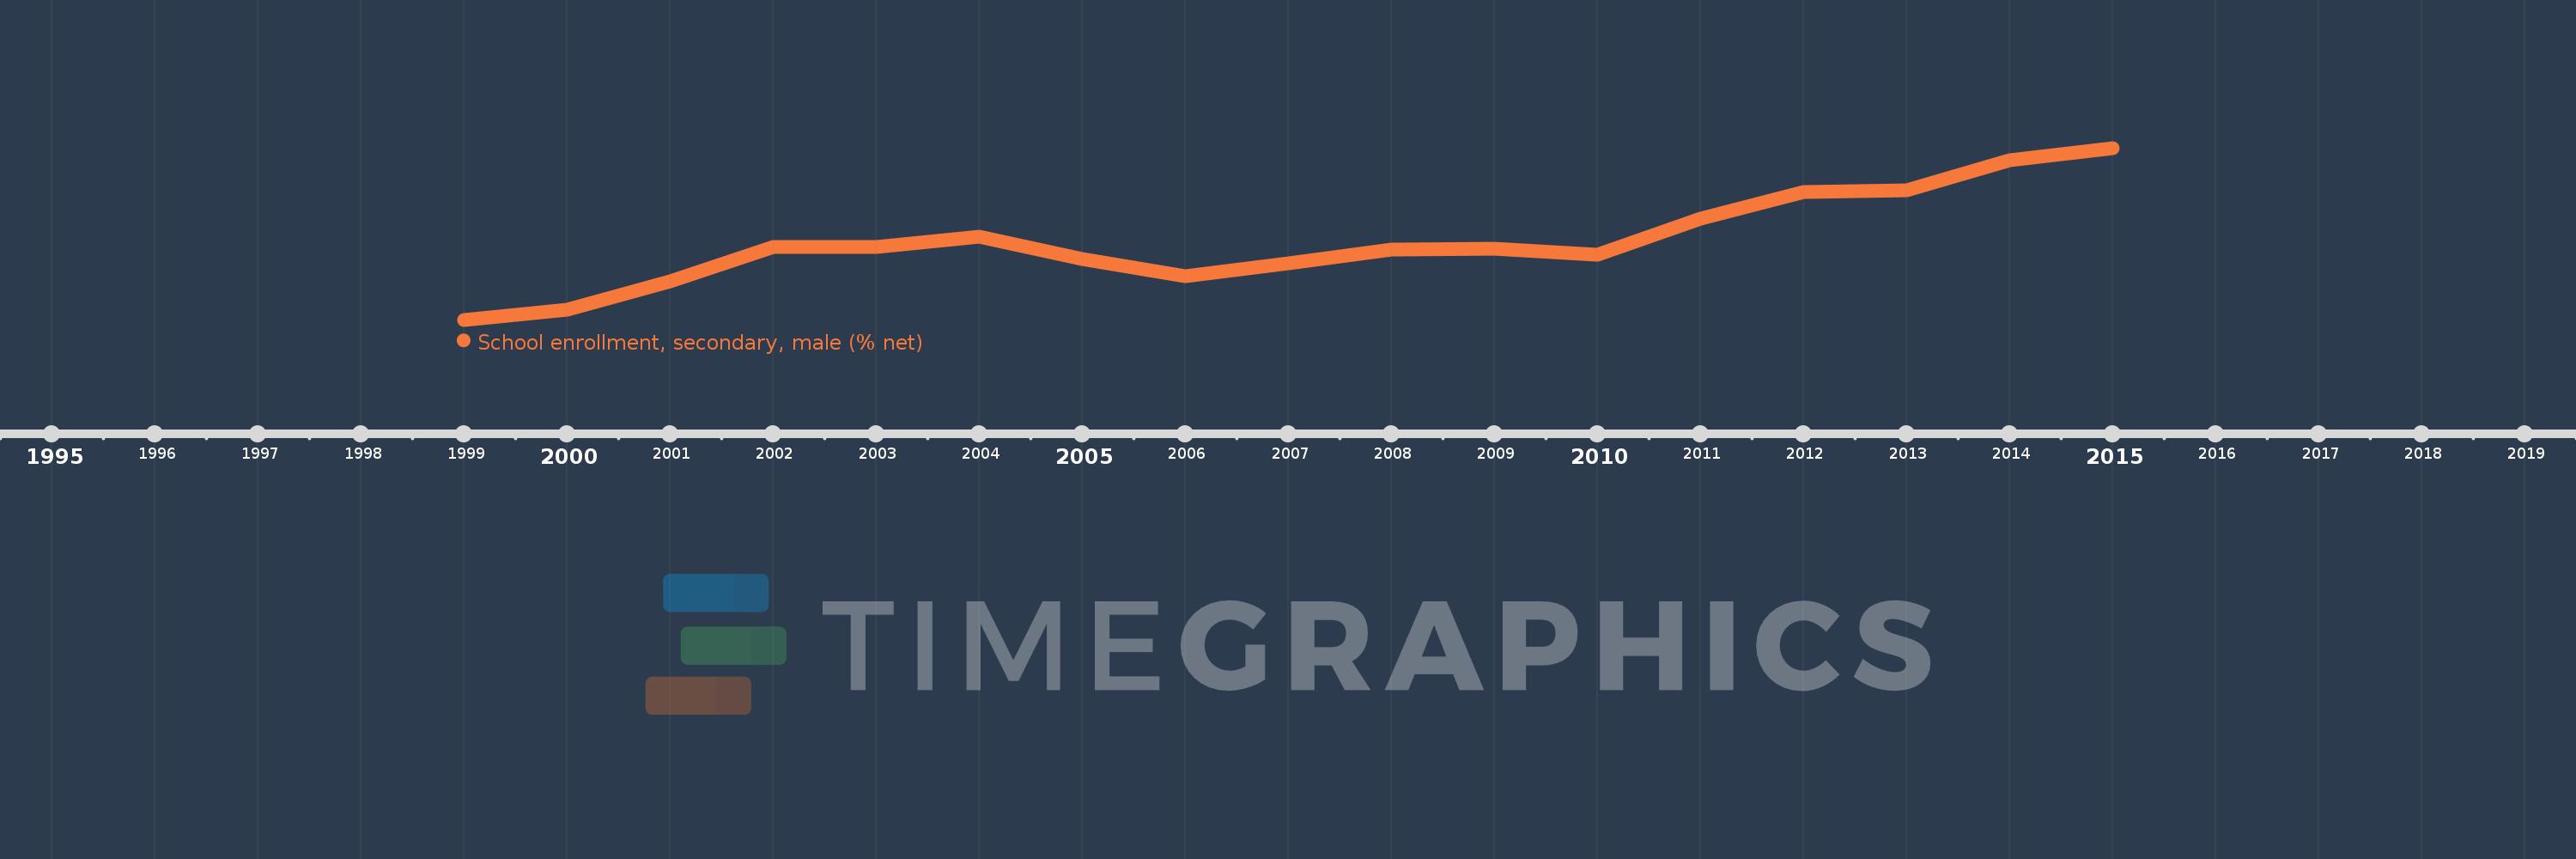
This timeline shows a graph from 1999 to 2015 of Europe & Central Asia (IDA & IBRD countries). No data until 1998. Number of actual observations by date: 17.
Source name:
World Development Indicators
Source organization:
United Nations Educational, Scientific, and Cultural Organization (UNESCO) Institute for Statistics.
Categories, topics:
Education, Gender
Last updated:
apr 23, 2017
Indicators value changes by year
Meaning:
83.756
Minimum:
79.758
jan 1, 1999
Maximum:
88.511
jan 1, 2015
At the date of observation
Value
Absolute change
Change from the previous value
jan 1, 1999
79.758
+79.758
0.0%
jan 1, 2000
80.279
+0.522
0.65%
jan 1, 2001
81.723
+1.444
1.8%
jan 1, 2002
83.473
+1.75
2.14%
jan 1, 2003
83.472
-0.001
0.0%
jan 1, 2004
83.986
+0.514
0.62%
jan 1, 2005
82.873
-1.113
-1.33%
jan 1, 2006
81.96
-0.913
-1.1%
jan 1, 2007
82.613
+0.653
0.8%
jan 1, 2008
83.352
+0.739
0.89%
jan 1, 2009
83.356
+0.004
0.0%
jan 1, 2010
83.079
-0.277
-0.33%
jan 1, 2011
84.906
+1.827
2.2%
jan 1, 2012
86.273
+1.367
1.61%
jan 1, 2013
86.372
+0.1
0.12%
jan 1, 2014
87.867
+1.494
1.73%
jan 1, 2015
88.511
+0.644
0.73%
Ranking of countries by current statistics by years