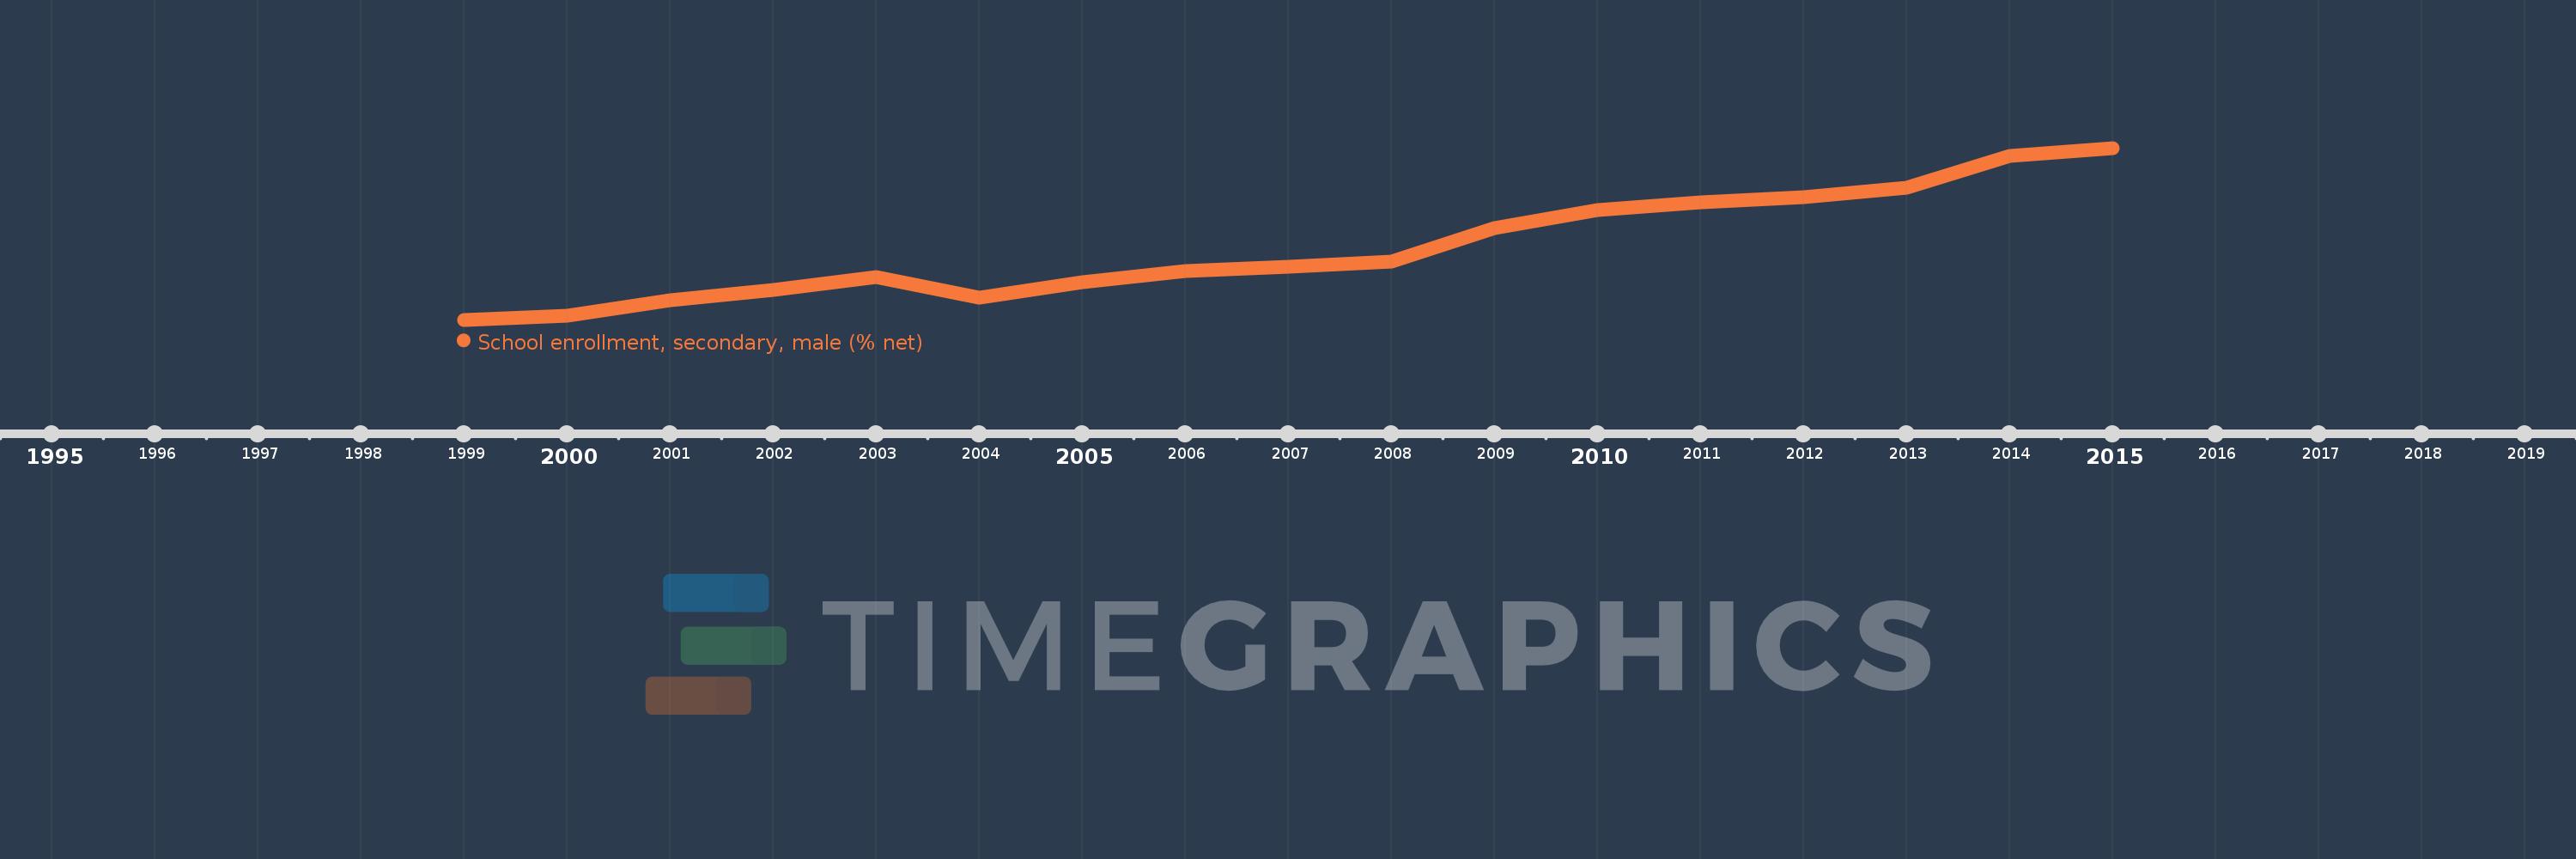
This timeline shows a graph from 1999 to 2015 of Latin America & Caribbean (excluding high income). No data until 1998. Number of actual observations by date: 17.
Source name:
World Development Indicators
Source organization:
United Nations Educational, Scientific, and Cultural Organization (UNESCO) Institute for Statistics.
Categories, topics:
Education, Gender
Last updated:
apr 23, 2017
Indicators value changes by year
Meaning:
66.487
Minimum:
61.423
jan 1, 1999
Maximum:
73.509
jan 1, 2015
At the date of observation
Value
Absolute change
Change from the previous value
jan 1, 1999
61.423
+61.423
0.0%
jan 1, 2000
61.706
+0.282
0.46%
jan 1, 2001
62.801
+1.095
1.78%
jan 1, 2002
63.498
+0.697
1.11%
jan 1, 2003
64.436
+0.938
1.48%
jan 1, 2004
62.981
-1.455
-2.26%
jan 1, 2005
64.046
+1.065
1.69%
jan 1, 2006
64.847
+0.801
1.25%
jan 1, 2007
65.179
+0.332
0.51%
jan 1, 2008
65.507
+0.327
0.5%
jan 1, 2009
67.87
+2.363
3.61%
jan 1, 2010
69.138
+1.268
1.87%
jan 1, 2011
69.694
+0.556
0.8%
jan 1, 2012
70.032
+0.337
0.48%
jan 1, 2013
70.695
+0.664
0.95%
jan 1, 2014
72.922
+2.227
3.15%
jan 1, 2015
73.509
+0.587
0.81%
Ranking of countries by current statistics by years