33
/
AIzaSyB4mHJ5NPEv-XzF7P6NDYXjlkCWaeKw5bc
November 30, 2025
81083
Belarus
BLR
true
2
1
PPG, IBRD (DIS, current US$)
2016,2015,2014,2013,2012,2011,2010,2009,2008,2007,2006,2005,2004,2003,2002,2001,2000,1999,1998,1997,1996,1995,1994
Create a timeline
Public Timelines
For education
For educational institutions
For teachers
For students
Cabinet
For educational institutions
For teachers
For students
Open cabinet
FAQ
Close
Create a timeline
Public timelines
FAQ
About & Feedback
Terms
Privacy
FAQ
Support 24/7
Cabinet
Get premium
Donate
Download
Global statistics library
→
Belarus
→
PPG, IBRD (DIS, current US$)
This statistics in other country:
Albania
Algeria
Angola
Argentina
Armenia
Azerbaijan
Bangladesh
Belarus
Belize
Bolivia
Bosnia and Herzegovina
Botswana
Brazil
Bulgaria
Cabo Verde
Cameroon
Chad
China
Colombia
Congo, Dem. Rep.
Congo, Rep.
Costa Rica
Cote d'Ivoire
Dominica
Dominican Republic
East Asia & Pacific (excluding high income)
Ecuador
Egypt, Arab Rep.
El Salvador
Ethiopia
Europe & Central Asia (excluding high income)
Fiji
Gabon
Georgia
Ghana
Grenada
Guatemala
Guinea
Guyana
Honduras
IDA only
India
Indonesia
Iran, Islamic Rep.
Jamaica
Jordan
Kazakhstan
Kenya
Kosovo
Latin America & Caribbean (excluding high income)
Lebanon
Lesotho
Liberia
Low & middle income
Low income
Lower middle income
Macedonia, FYR
Madagascar
Malawi
Malaysia
Mauritania
Mauritius
Mexico
Middle East & North Africa (excluding high income)
Middle income
Moldova
Montenegro
Morocco
Nicaragua
Nigeria
Pakistan
Panama
Papua New Guinea
Paraguay
Peru
Philippines
Romania
Russian Federation
Senegal
Serbia
Sierra Leone
South Africa
South Asia
Sri Lanka
St. Lucia
St. Vincent and the Grenadines
Sub-Saharan Africa (excluding high income)
Sudan
Swaziland
Syrian Arab Republic
Tanzania
Thailand
Togo
Tunisia
Turkey
Turkmenistan
Uganda
Ukraine
Upper middle income
Uzbekistan
Venezuela, RB
Vietnam
Zambia
Zimbabwe
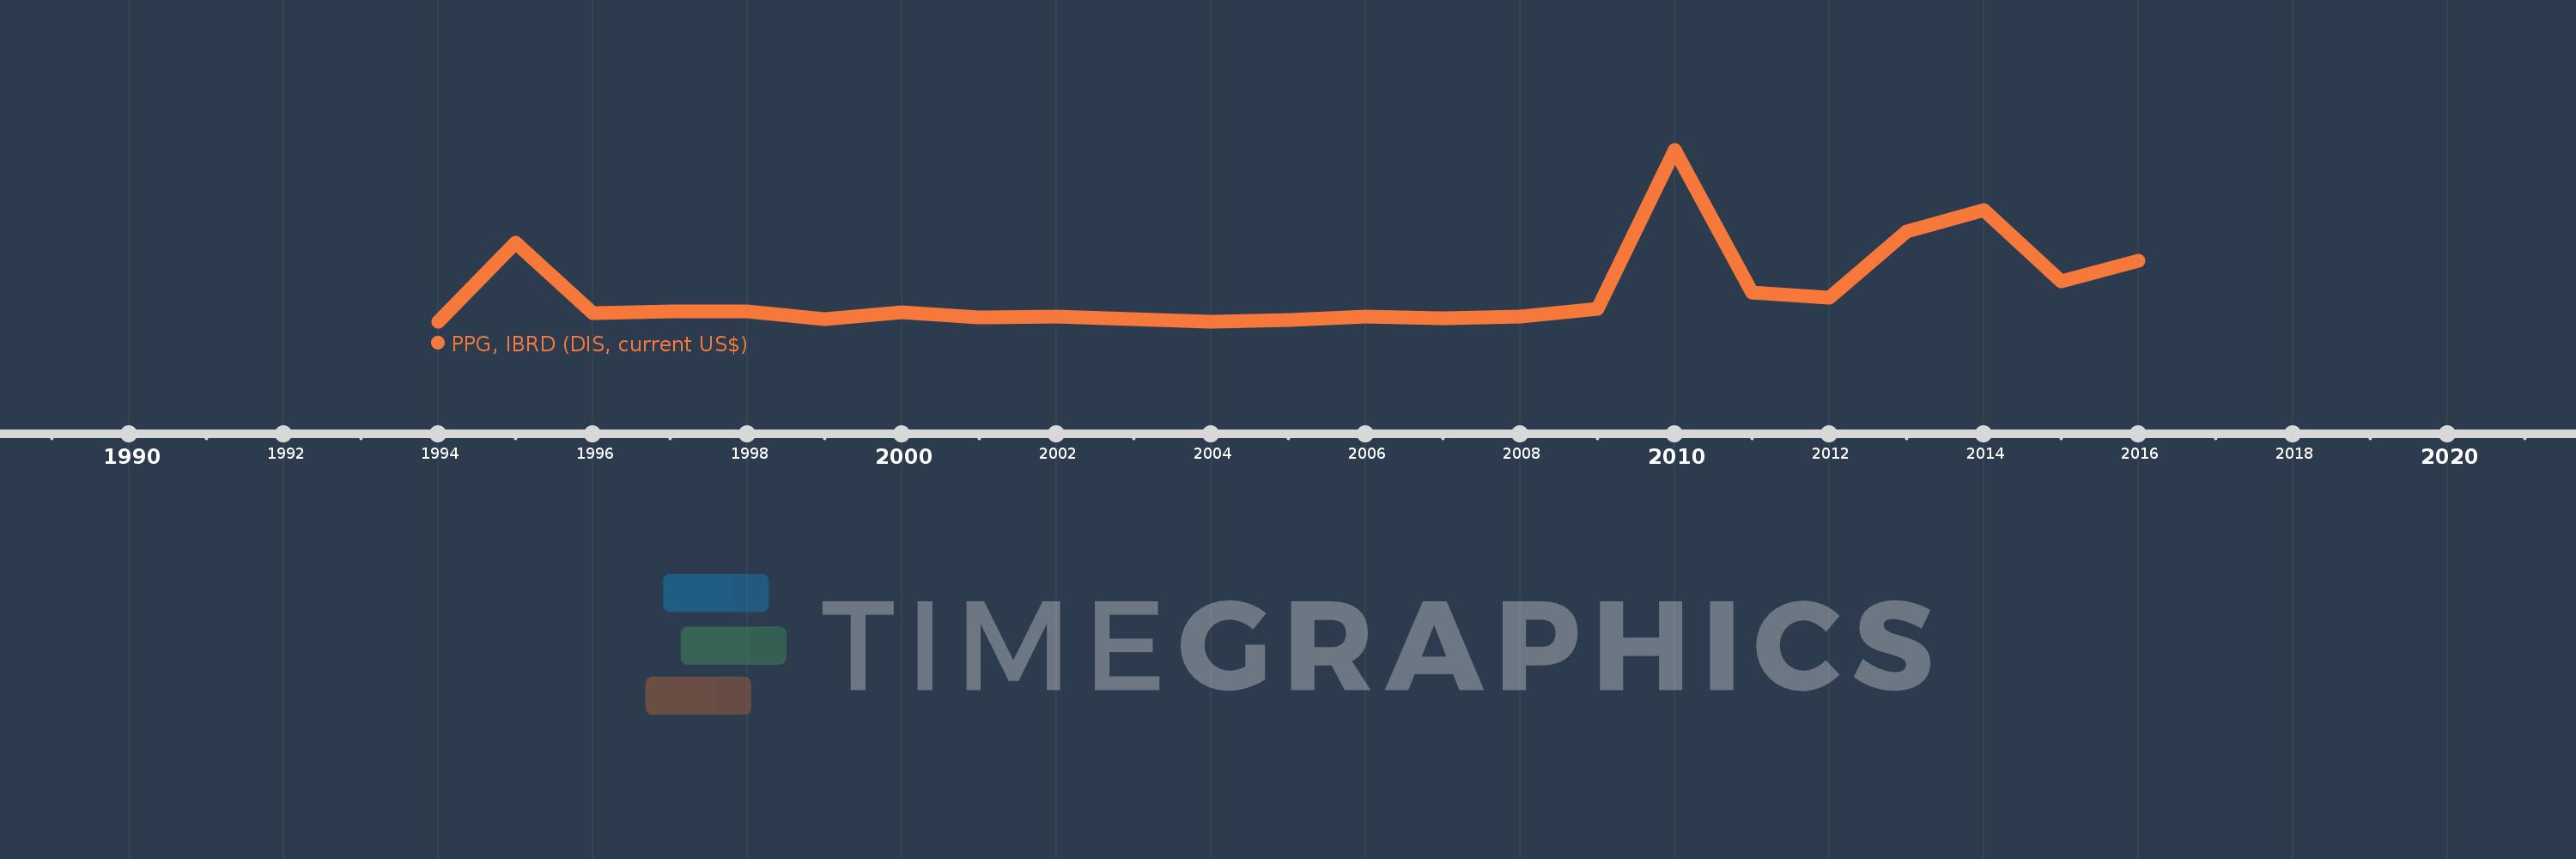
Timeline:
This timeline shows a graph from
1994
to
2016
of Belarus. No data until
1993
. Number of actual observations by date:
23
.
Source name:
World Development Indicators
Source organization:
World Bank, International Debt Statistics.
Categories, topics:
External Debt
Last updated:
apr 23, 2017
Indicators value changes by year
Meaning:
38.053 mln
Minimum:
100.0K
jan 1, 1994
Maximum:
216.17 mln
jan 1, 2010
At the date of observation
Value
Absolute change
Change from the previous value
jan 1, 1994
100.0K
+100.0K
0.0%
jan 1, 1995
100.142 mln
+100.042 mln
100.04K%
jan 1, 1996
11.228 mln
-88.914 mln
-88.79%
jan 1, 1997
13.881 mln
+2.653 mln
23.63%
jan 1, 1998
13.343 mln
-538.0K
-3.88%
jan 1, 1999
3.567 mln
-9.776 mln
-73.27%
jan 1, 2000
12.531 mln
+8.964 mln
251.3%
jan 1, 2001
5.511 mln
-7.02 mln
-56.02%
jan 1, 2002
6.424 mln
+913.0K
16.57%
jan 1, 2003
3.86 mln
-2.564 mln
-39.91%
jan 1, 2004
592.0K
-3.268 mln
-84.66%
jan 1, 2005
2.37 mln
+1.778 mln
300.34%
jan 1, 2006
6.841 mln
+4.471 mln
188.65%
jan 1, 2007
5.205 mln
-1.636 mln
-23.91%
jan 1, 2008
7.424 mln
+2.219 mln
42.63%
jan 1, 2009
16.371 mln
+8.947 mln
120.51%
jan 1, 2010
216.17 mln
+199.799 mln
1.22K%
jan 1, 2011
36.788 mln
-179.382 mln
-82.98%
jan 1, 2012
30.154 mln
-6.634 mln
-18.03%
jan 1, 2013
113.452 mln
+83.298 mln
276.24%
jan 1, 2014
140.737 mln
+27.285 mln
24.05%
jan 1, 2015
51.401 mln
-89.336 mln
-63.48%
jan 1, 2016
77.125 mln
+25.724 mln
50.05%
Ranking of countries by current statistics by years
About & Feedback
Terms
Privacy
FAQ
Support 24/7
Cabinet
Get premium
Donate
The service accepts bank transfer (ACH, Wire) or cards (Visa, MasterCard, etc). Processed by Stripe.
Secured with SSL