33
/
AIzaSyB4mHJ5NPEv-XzF7P6NDYXjlkCWaeKw5bc
November 30, 2025
274135
Ukraine
UKR
true
2
1
PPG, IBRD (DIS, current US$)
2016,2015,2014,2013,2012,2011,2010,2009,2008,2007,2006,2005,2004,2003,2002,2001,2000,1999,1998,1997,1996,1995,1994
Create a timeline
Public Timelines
For education
For educational institutions
For teachers
For students
Cabinet
For educational institutions
For teachers
For students
Open cabinet
FAQ
Close
Create a timeline
Public timelines
FAQ
About & Feedback
Terms
Privacy
FAQ
Support 24/7
Cabinet
Get premium
Donate
Download
Global statistics library
→
Ukraine
→
PPG, IBRD (DIS, current US$)
This statistics in other country:
Albania
Algeria
Angola
Argentina
Armenia
Azerbaijan
Bangladesh
Belarus
Belize
Bolivia
Bosnia and Herzegovina
Botswana
Brazil
Bulgaria
Cabo Verde
Cameroon
Chad
China
Colombia
Congo, Dem. Rep.
Congo, Rep.
Costa Rica
Cote d'Ivoire
Dominica
Dominican Republic
East Asia & Pacific (excluding high income)
Ecuador
Egypt, Arab Rep.
El Salvador
Ethiopia
Europe & Central Asia (excluding high income)
Fiji
Gabon
Georgia
Ghana
Grenada
Guatemala
Guinea
Guyana
Honduras
IDA only
India
Indonesia
Iran, Islamic Rep.
Jamaica
Jordan
Kazakhstan
Kenya
Kosovo
Latin America & Caribbean (excluding high income)
Lebanon
Lesotho
Liberia
Low & middle income
Low income
Lower middle income
Macedonia, FYR
Madagascar
Malawi
Malaysia
Mauritania
Mauritius
Mexico
Middle East & North Africa (excluding high income)
Middle income
Moldova
Montenegro
Morocco
Nicaragua
Nigeria
Pakistan
Panama
Papua New Guinea
Paraguay
Peru
Philippines
Romania
Russian Federation
Senegal
Serbia
Sierra Leone
South Africa
South Asia
Sri Lanka
St. Lucia
St. Vincent and the Grenadines
Sub-Saharan Africa (excluding high income)
Sudan
Swaziland
Syrian Arab Republic
Tanzania
Thailand
Togo
Tunisia
Turkey
Turkmenistan
Uganda
Ukraine
Upper middle income
Uzbekistan
Venezuela, RB
Vietnam
Zambia
Zimbabwe
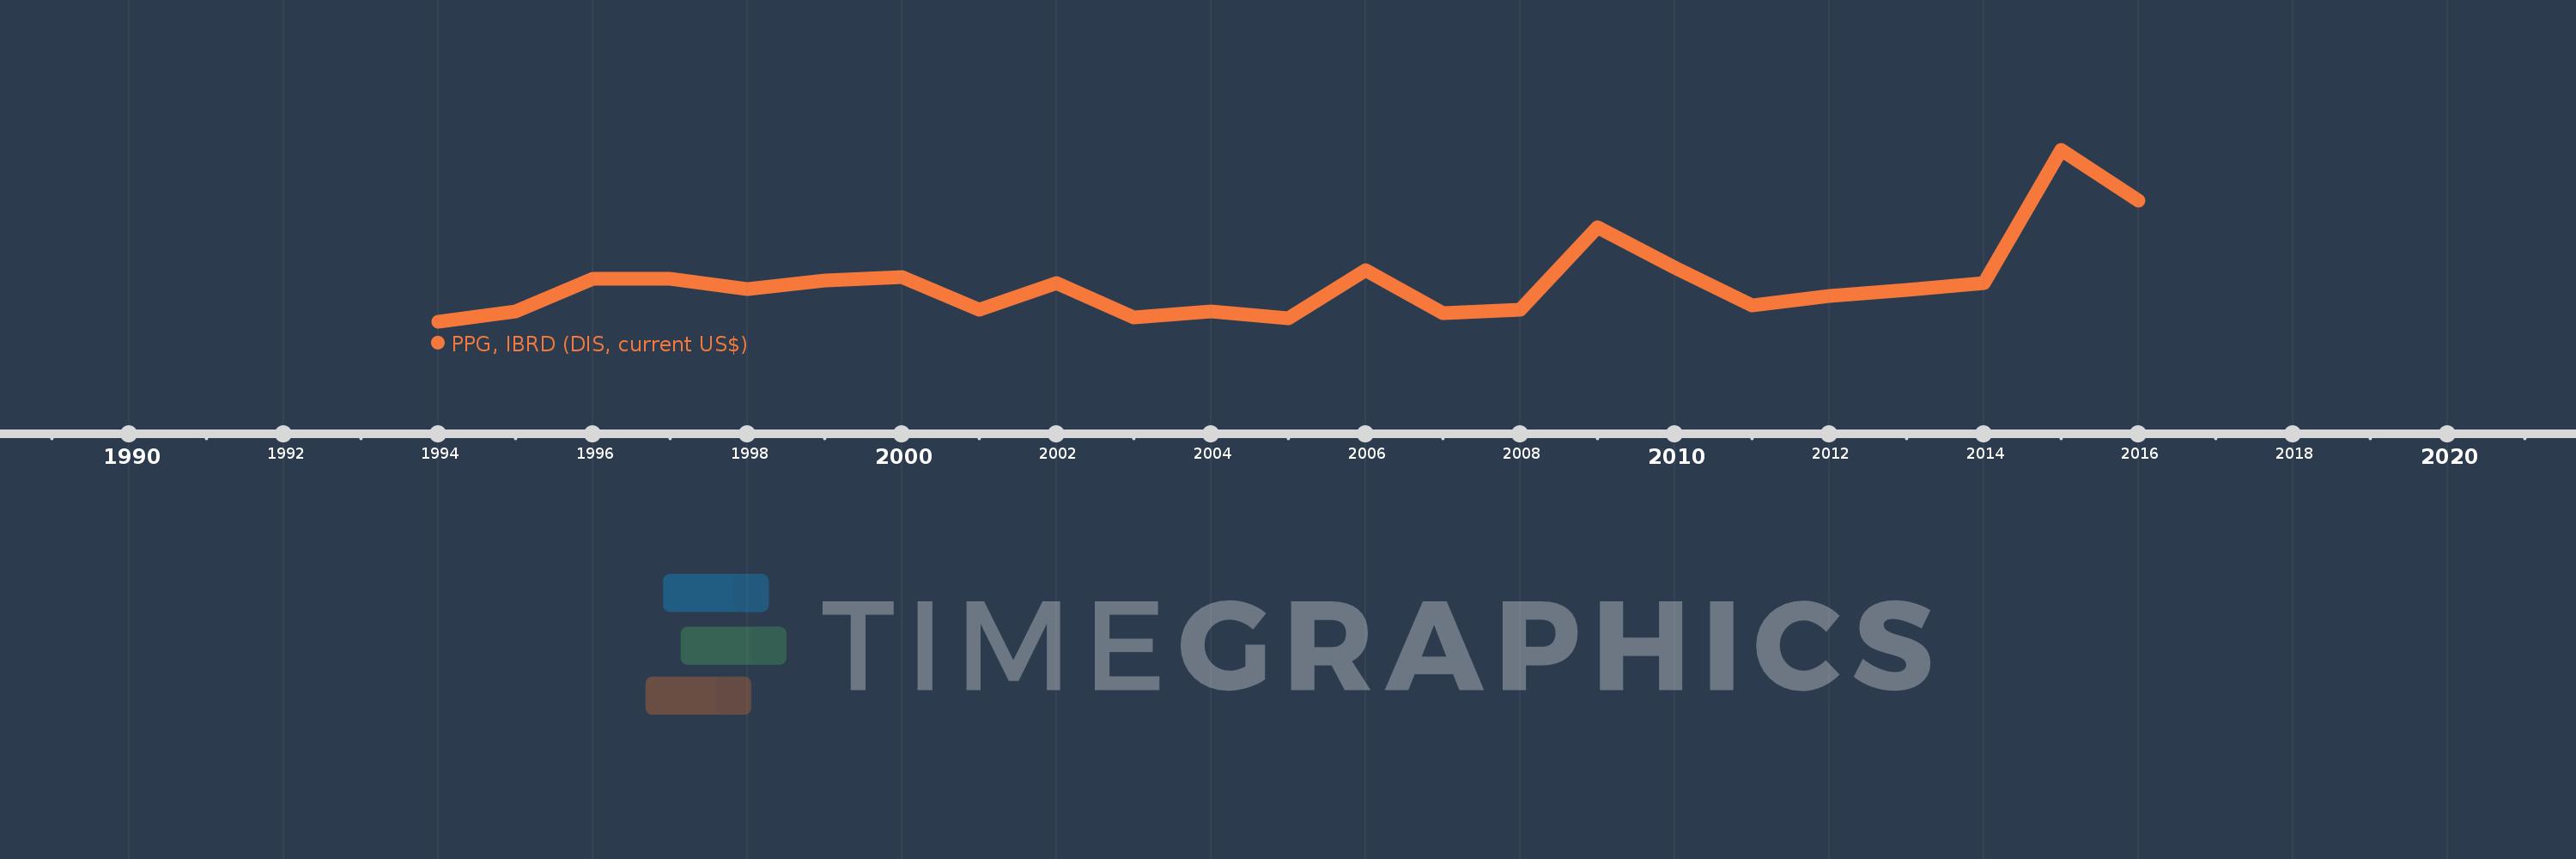
Timeline:
This timeline shows a graph from
1994
to
2016
of Ukraine. No data until
1993
. Number of actual observations by date:
23
.
Source name:
World Development Indicators
Source organization:
World Bank, International Debt Statistics.
Categories, topics:
External Debt
Last updated:
apr 23, 2017
Indicators value changes by year
Meaning:
372.316 mln
Minimum:
69.0K
jan 1, 1994
Maximum:
1.609 bln
jan 1, 2015
At the date of observation
Value
Absolute change
Change from the previous value
jan 1, 1994
69.0K
+69.0K
0.0%
jan 1, 1995
101.615 mln
+101.546 mln
147.17K%
jan 1, 1996
400.948 mln
+299.333 mln
294.58%
jan 1, 1997
405.986 mln
+5.038 mln
1.26%
jan 1, 1998
305.507 mln
-100.479 mln
-24.75%
jan 1, 1999
384.746 mln
+79.239 mln
25.94%
jan 1, 2000
422.437 mln
+37.691 mln
9.8%
jan 1, 2001
112.666 mln
-309.771 mln
-73.33%
jan 1, 2002
364.365 mln
+251.699 mln
223.4%
jan 1, 2003
44.891 mln
-319.474 mln
-87.68%
jan 1, 2004
95.325 mln
+50.434 mln
112.35%
jan 1, 2005
32.915 mln
-62.41 mln
-65.47%
jan 1, 2006
483.843 mln
+450.928 mln
1.37K%
jan 1, 2007
85.055 mln
-398.788 mln
-82.42%
jan 1, 2008
114.524 mln
+29.469 mln
34.65%
jan 1, 2009
889.444 mln
+774.92 mln
676.64%
jan 1, 2010
509.041 mln
-380.403 mln
-42.77%
jan 1, 2011
158.4 mln
-350.641 mln
-68.88%
jan 1, 2012
244.066 mln
+85.666 mln
54.08%
jan 1, 2013
300.095 mln
+56.029 mln
22.96%
jan 1, 2014
363.374 mln
+63.279 mln
21.09%
jan 1, 2015
1.609 bln
+1.245 bln
342.74%
jan 1, 2016
1.135 bln
-473.626 mln
-29.44%
Ranking of countries by current statistics by years
About & Feedback
Terms
Privacy
FAQ
Support 24/7
Cabinet
Get premium
Donate
The service accepts bank transfer (ACH, Wire) or cards (Visa, MasterCard, etc). Processed by Stripe.
Secured with SSL