33
/
AIzaSyB4mHJ5NPEv-XzF7P6NDYXjlkCWaeKw5bc
November 30, 2025
279193
Uzbekistan
UZB
true
2
1
PPG, IBRD (DIS, current US$)
2016,2015,2014,2013,2012,2011,2010,2009,2008,2007,2006,2005,2004,2003,2002,2001,2000,1999,1998,1997,1996,1995
Create a timeline
Public Timelines
For education
For educational institutions
For teachers
For students
Cabinet
For educational institutions
For teachers
For students
Open cabinet
FAQ
Close
Create a timeline
Public timelines
FAQ
About & Feedback
Terms
Privacy
FAQ
Support 24/7
Cabinet
Get premium
Donate
Download
Global statistics library
→
Uzbekistan
→
PPG, IBRD (DIS, current US$)
This statistics in other country:
Albania
Algeria
Angola
Argentina
Armenia
Azerbaijan
Bangladesh
Belarus
Belize
Bolivia
Bosnia and Herzegovina
Botswana
Brazil
Bulgaria
Cabo Verde
Cameroon
Chad
China
Colombia
Congo, Dem. Rep.
Congo, Rep.
Costa Rica
Cote d'Ivoire
Dominica
Dominican Republic
East Asia & Pacific (excluding high income)
Ecuador
Egypt, Arab Rep.
El Salvador
Ethiopia
Europe & Central Asia (excluding high income)
Fiji
Gabon
Georgia
Ghana
Grenada
Guatemala
Guinea
Guyana
Honduras
IDA only
India
Indonesia
Iran, Islamic Rep.
Jamaica
Jordan
Kazakhstan
Kenya
Kosovo
Latin America & Caribbean (excluding high income)
Lebanon
Lesotho
Liberia
Low & middle income
Low income
Lower middle income
Macedonia, FYR
Madagascar
Malawi
Malaysia
Mauritania
Mauritius
Mexico
Middle East & North Africa (excluding high income)
Middle income
Moldova
Montenegro
Morocco
Nicaragua
Nigeria
Pakistan
Panama
Papua New Guinea
Paraguay
Peru
Philippines
Romania
Russian Federation
Senegal
Serbia
Sierra Leone
South Africa
South Asia
Sri Lanka
St. Lucia
St. Vincent and the Grenadines
Sub-Saharan Africa (excluding high income)
Sudan
Swaziland
Syrian Arab Republic
Tanzania
Thailand
Togo
Tunisia
Turkey
Turkmenistan
Uganda
Ukraine
Upper middle income
Uzbekistan
Venezuela, RB
Vietnam
Zambia
Zimbabwe
Timeline:
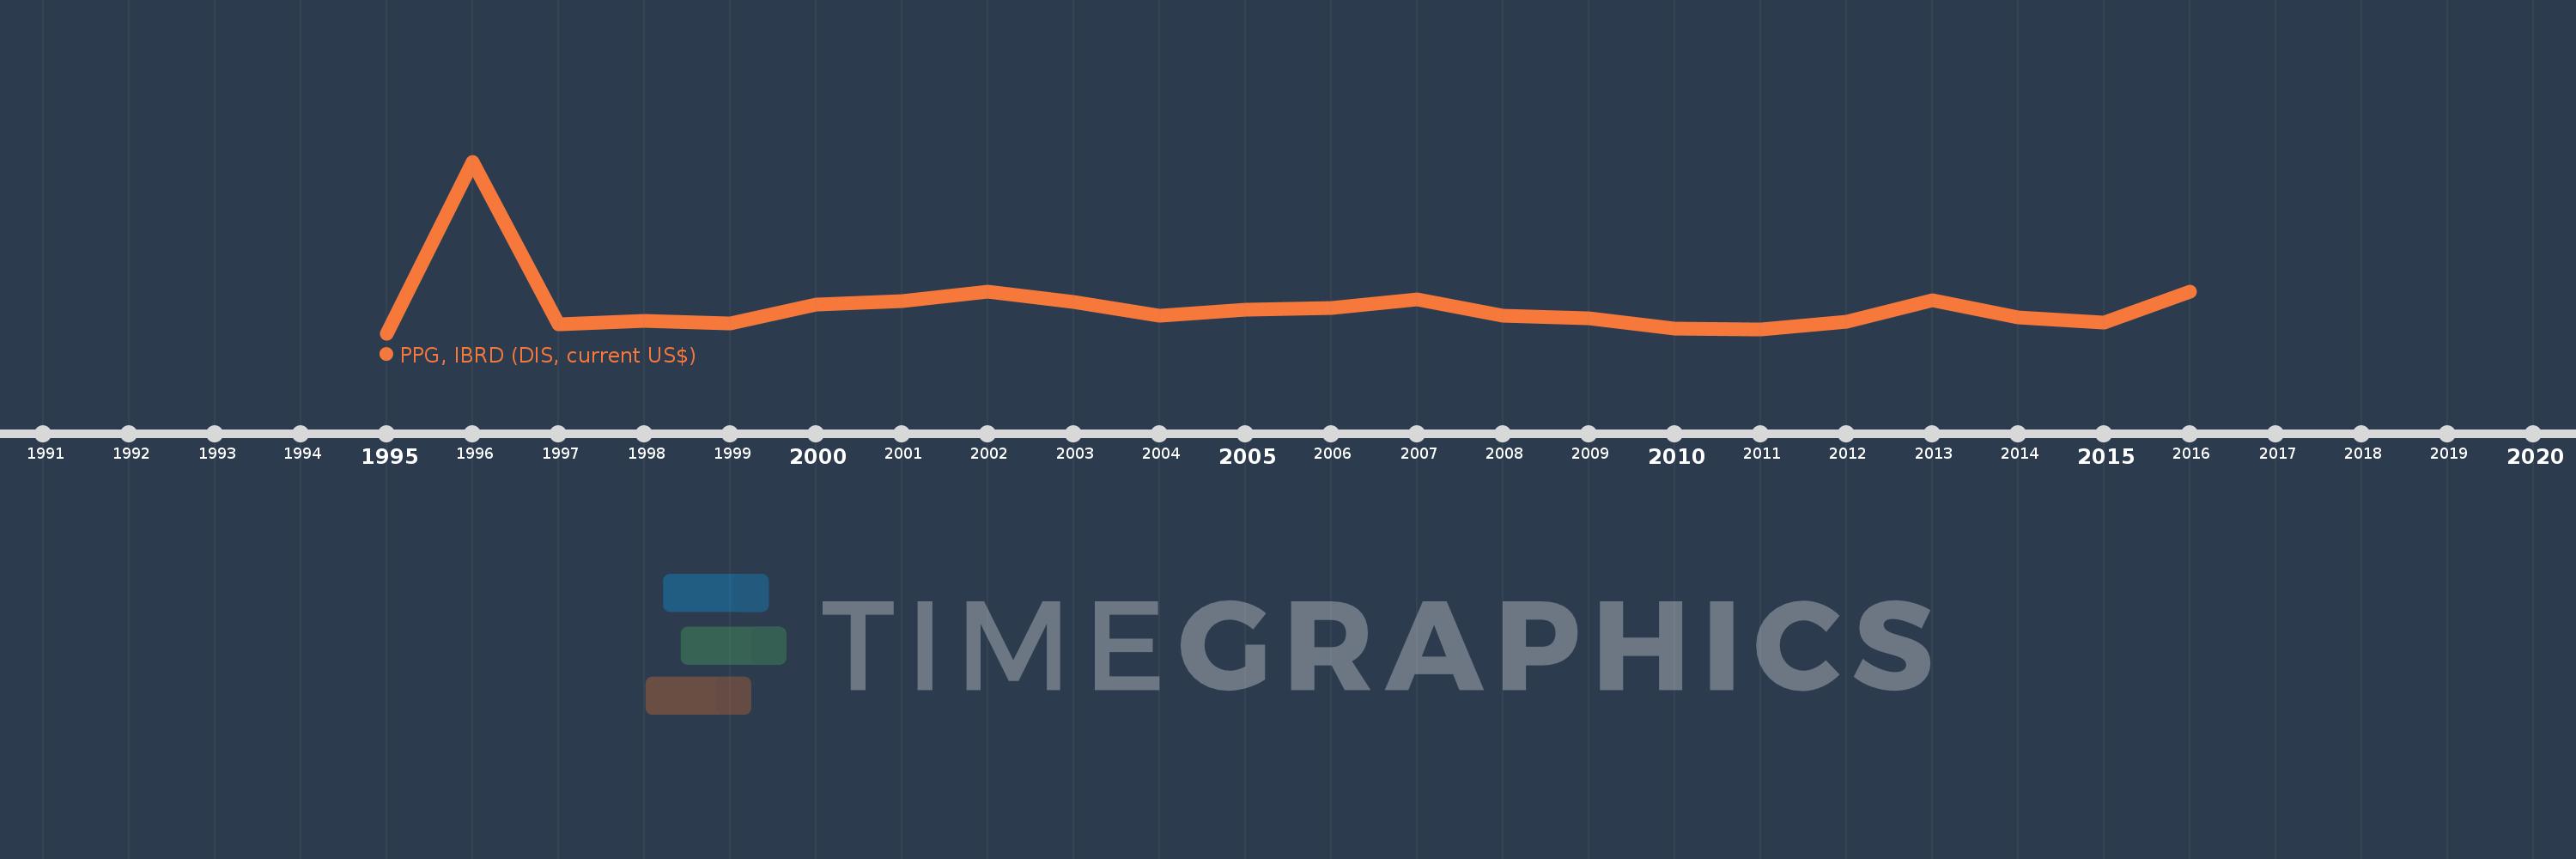
This timeline shows a graph from
1995
to
2016
of Uzbekistan. No data until
1994
. Number of actual observations by date:
22
.
Source name:
World Development Indicators
Source organization:
World Bank, International Debt Statistics.
Categories, topics:
External Debt
Last updated:
apr 23, 2017
Indicators value changes by year
Meaning:
26.111 mln
Minimum:
893.0K
jan 1, 1995
Maximum:
162.113 mln
jan 1, 1996
At the date of observation
Value
Absolute change
Change from the previous value
jan 1, 1995
893.0K
+893.0K
0.0%
jan 1, 1996
162.113 mln
+161.22 mln
18.05K%
jan 1, 1997
8.982 mln
-153.131 mln
-94.46%
jan 1, 1998
12.92 mln
+3.938 mln
43.84%
jan 1, 1999
10.308 mln
-2.612 mln
-20.22%
jan 1, 2000
27.888 mln
+17.58 mln
170.55%
jan 1, 2001
31.313 mln
+3.425 mln
12.28%
jan 1, 2002
39.643 mln
+8.33 mln
26.6%
jan 1, 2003
30.605 mln
-9.038 mln
-22.8%
jan 1, 2004
17.03 mln
-13.575 mln
-44.36%
jan 1, 2005
23.145 mln
+6.115 mln
35.91%
jan 1, 2006
24.698 mln
+1.553 mln
6.71%
jan 1, 2007
32.482 mln
+7.784 mln
31.52%
jan 1, 2008
17.459 mln
-15.023 mln
-46.25%
jan 1, 2009
15.302 mln
-2.157 mln
-12.35%
jan 1, 2010
4.947 mln
-10.355 mln
-67.67%
jan 1, 2011
4.539 mln
-408.0K
-8.25%
jan 1, 2012
11.583 mln
+7.044 mln
155.19%
jan 1, 2013
31.753 mln
+20.17 mln
174.13%
jan 1, 2014
15.598 mln
-16.155 mln
-50.88%
jan 1, 2015
11.305 mln
-4.293 mln
-27.52%
jan 1, 2016
39.93 mln
+28.625 mln
253.21%
Ranking of countries by current statistics by years
About & Feedback
Terms
Privacy
FAQ
Support 24/7
Cabinet
Get premium
Donate
The service accepts bank transfer (ACH, Wire) or cards (Visa, MasterCard, etc). Processed by Stripe.
Secured with SSL