33
/
AIzaSyB4mHJ5NPEv-XzF7P6NDYXjlkCWaeKw5bc
November 30, 2025
166699
Kazakhstan
KAZ
true
2
1
PPG, IBRD (DIS, current US$)
2016,2015,2014,2013,2012,2011,2010,2009,2008,2007,2006,2005,2004,2003,2002,2001,2000,1999,1998,1997,1996,1995
Create a timeline
Public Timelines
For education
For educational institutions
For teachers
For students
Cabinet
For educational institutions
For teachers
For students
Open cabinet
FAQ
Close
Create a timeline
Public timelines
FAQ
About & Feedback
Terms
Privacy
FAQ
Support 24/7
Cabinet
Get premium
Donate
Download
Global statistics library
→
Kazakhstan
→
PPG, IBRD (DIS, current US$)
This statistics in other country:
Albania
Algeria
Angola
Argentina
Armenia
Azerbaijan
Bangladesh
Belarus
Belize
Bolivia
Bosnia and Herzegovina
Botswana
Brazil
Bulgaria
Cabo Verde
Cameroon
Chad
China
Colombia
Congo, Dem. Rep.
Congo, Rep.
Costa Rica
Cote d'Ivoire
Dominica
Dominican Republic
East Asia & Pacific (excluding high income)
Ecuador
Egypt, Arab Rep.
El Salvador
Ethiopia
Europe & Central Asia (excluding high income)
Fiji
Gabon
Georgia
Ghana
Grenada
Guatemala
Guinea
Guyana
Honduras
IDA only
India
Indonesia
Iran, Islamic Rep.
Jamaica
Jordan
Kazakhstan
Kenya
Kosovo
Latin America & Caribbean (excluding high income)
Lebanon
Lesotho
Liberia
Low & middle income
Low income
Lower middle income
Macedonia, FYR
Madagascar
Malawi
Malaysia
Mauritania
Mauritius
Mexico
Middle East & North Africa (excluding high income)
Middle income
Moldova
Montenegro
Morocco
Nicaragua
Nigeria
Pakistan
Panama
Papua New Guinea
Paraguay
Peru
Philippines
Romania
Russian Federation
Senegal
Serbia
Sierra Leone
South Africa
South Asia
Sri Lanka
St. Lucia
St. Vincent and the Grenadines
Sub-Saharan Africa (excluding high income)
Sudan
Swaziland
Syrian Arab Republic
Tanzania
Thailand
Togo
Tunisia
Turkey
Turkmenistan
Uganda
Ukraine
Upper middle income
Uzbekistan
Venezuela, RB
Vietnam
Zambia
Zimbabwe
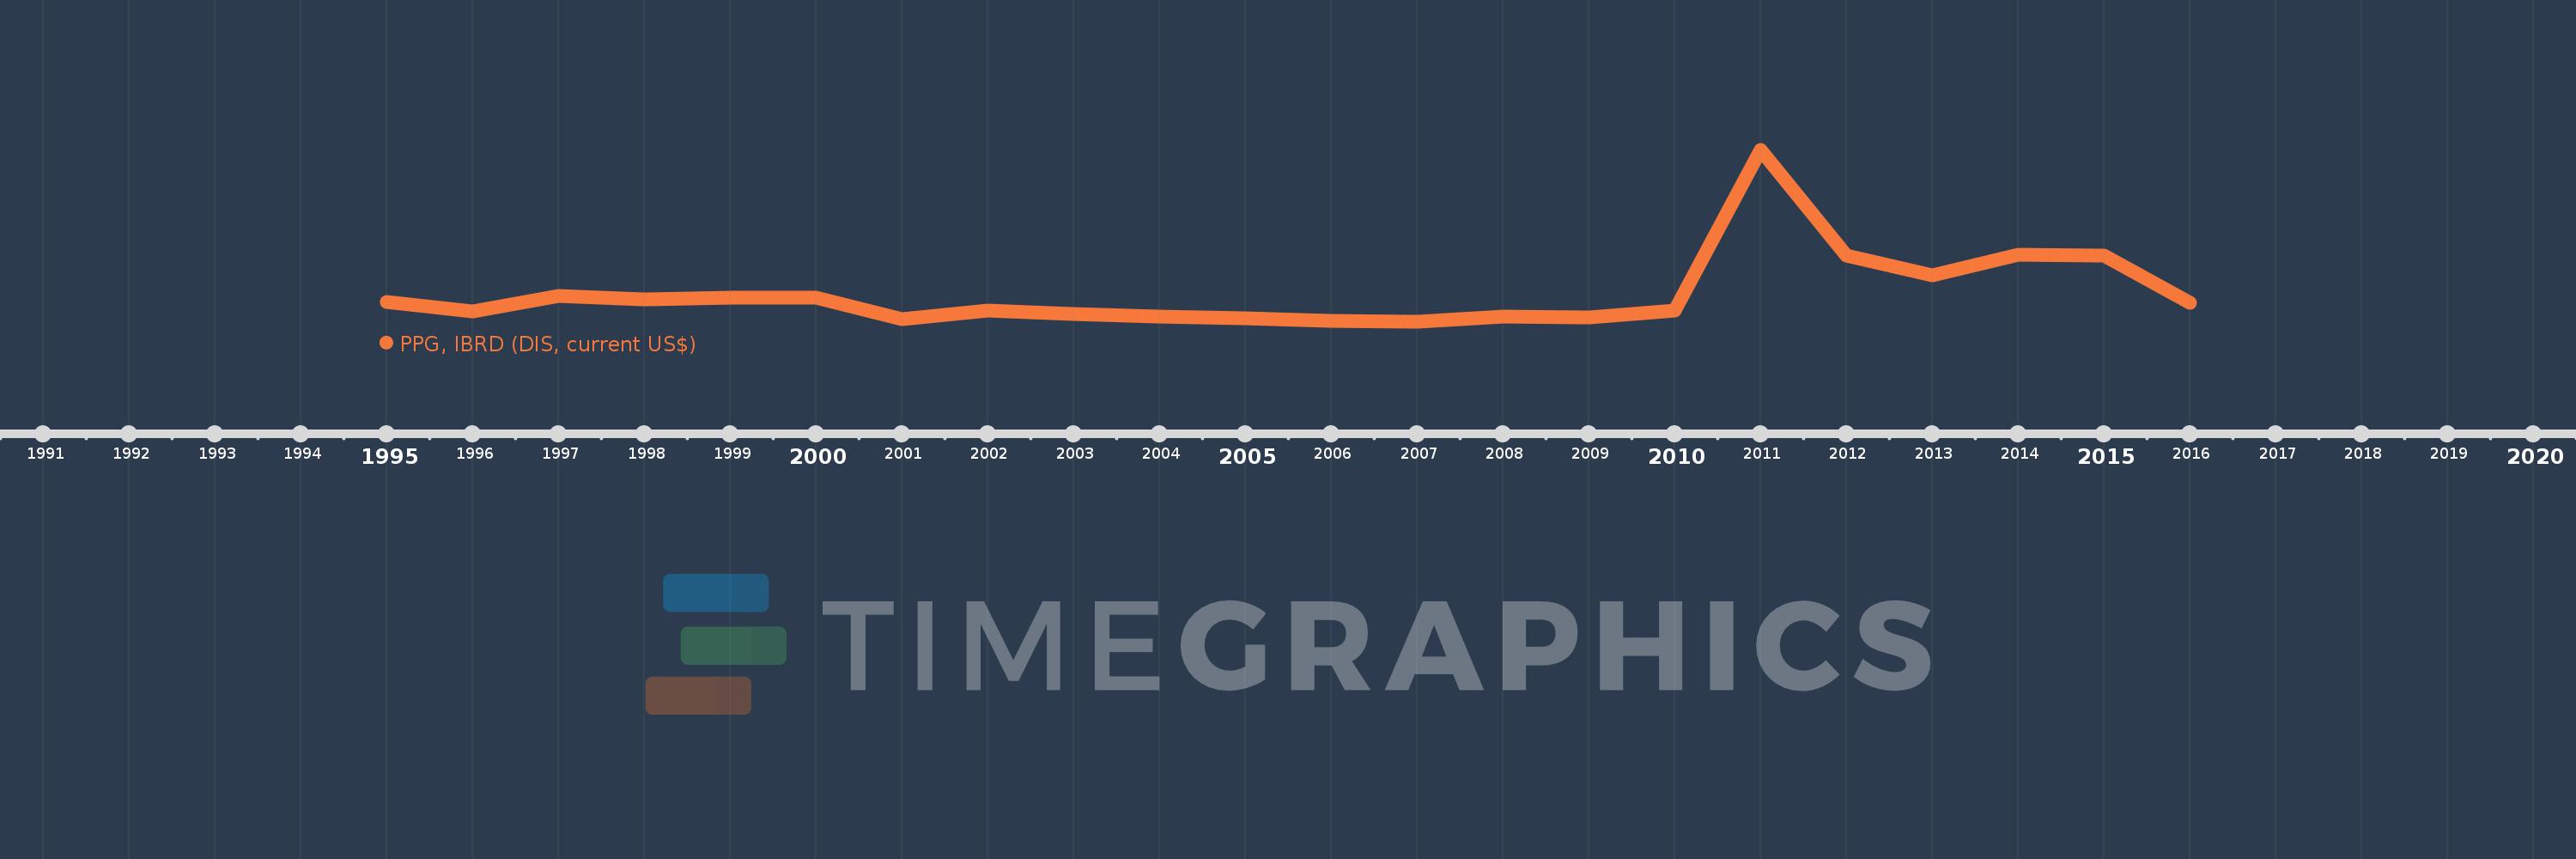
Timeline:
This timeline shows a graph from
1995
to
2016
of Kazakhstan. No data until
1994
. Number of actual observations by date:
22
.
Source name:
World Development Indicators
Source organization:
World Bank, International Debt Statistics.
Categories, topics:
External Debt
Last updated:
apr 23, 2017
Indicators value changes by year
Meaning:
240.922 mln
Minimum:
28.704 mln
jan 1, 2007
Maximum:
1.32 bln
jan 1, 2011
At the date of observation
Value
Absolute change
Change from the previous value
jan 1, 1995
181.834 mln
+181.834 mln
0.0%
jan 1, 1996
107.448 mln
-74.386 mln
-40.91%
jan 1, 1997
225.076 mln
+117.628 mln
109.47%
jan 1, 1998
201.661 mln
-23.415 mln
-10.4%
jan 1, 1999
210.804 mln
+9.143 mln
4.53%
jan 1, 2000
208.779 mln
-2.025 mln
-0.96%
jan 1, 2001
50.045 mln
-158.734 mln
-76.03%
jan 1, 2002
113.765 mln
+63.72 mln
127.33%
jan 1, 2003
91.985 mln
-21.78 mln
-19.14%
jan 1, 2004
70.512 mln
-21.473 mln
-23.34%
jan 1, 2005
59.651 mln
-10.861 mln
-15.4%
jan 1, 2006
36.578 mln
-23.073 mln
-38.68%
jan 1, 2007
28.704 mln
-7.874 mln
-21.53%
jan 1, 2008
66.937 mln
+38.233 mln
133.2%
jan 1, 2009
64.783 mln
-2.154 mln
-3.22%
jan 1, 2010
115.428 mln
+50.645 mln
78.18%
jan 1, 2011
1.32 bln
+1.205 bln
1.04K%
jan 1, 2012
525.485 mln
-794.795 mln
-60.2%
jan 1, 2013
381.987 mln
-143.498 mln
-27.31%
jan 1, 2014
537.133 mln
+155.146 mln
40.62%
jan 1, 2015
528.029 mln
-9.104 mln
-1.69%
jan 1, 2016
173.378 mln
-354.651 mln
-67.17%
Ranking of countries by current statistics by years
About & Feedback
Terms
Privacy
FAQ
Support 24/7
Cabinet
Get premium
Donate
The service accepts bank transfer (ACH, Wire) or cards (Visa, MasterCard, etc). Processed by Stripe.
Secured with SSL