33
/
AIzaSyB4mHJ5NPEv-XzF7P6NDYXjlkCWaeKw5bc
November 30, 2025
184409
Macedonia, FYR
MKD
true
2
1
PPG, IBRD (DIS, current US$)
2016,2015,2014,2013,2012,2011,2010,2009,2008,2007,2006,2005,2004,2003,2002,2001,2000,1999,1998,1997,1996,1995,1994
Create a timeline
Public Timelines
For education
For educational institutions
For teachers
For students
Cabinet
For educational institutions
For teachers
For students
Open cabinet
FAQ
Close
Create a timeline
Public timelines
FAQ
About & Feedback
Terms
Privacy
FAQ
Support 24/7
Cabinet
Get premium
Donate
Download
Global statistics library
→
Macedonia, FYR
→
PPG, IBRD (DIS, current US$)
This statistics in other country:
Albania
Algeria
Angola
Argentina
Armenia
Azerbaijan
Bangladesh
Belarus
Belize
Bolivia
Bosnia and Herzegovina
Botswana
Brazil
Bulgaria
Cabo Verde
Cameroon
Chad
China
Colombia
Congo, Dem. Rep.
Congo, Rep.
Costa Rica
Cote d'Ivoire
Dominica
Dominican Republic
East Asia & Pacific (excluding high income)
Ecuador
Egypt, Arab Rep.
El Salvador
Ethiopia
Europe & Central Asia (excluding high income)
Fiji
Gabon
Georgia
Ghana
Grenada
Guatemala
Guinea
Guyana
Honduras
IDA only
India
Indonesia
Iran, Islamic Rep.
Jamaica
Jordan
Kazakhstan
Kenya
Kosovo
Latin America & Caribbean (excluding high income)
Lebanon
Lesotho
Liberia
Low & middle income
Low income
Lower middle income
Macedonia, FYR
Madagascar
Malawi
Malaysia
Mauritania
Mauritius
Mexico
Middle East & North Africa (excluding high income)
Middle income
Moldova
Montenegro
Morocco
Nicaragua
Nigeria
Pakistan
Panama
Papua New Guinea
Paraguay
Peru
Philippines
Romania
Russian Federation
Senegal
Serbia
Sierra Leone
South Africa
South Asia
Sri Lanka
St. Lucia
St. Vincent and the Grenadines
Sub-Saharan Africa (excluding high income)
Sudan
Swaziland
Syrian Arab Republic
Tanzania
Thailand
Togo
Tunisia
Turkey
Turkmenistan
Uganda
Ukraine
Upper middle income
Uzbekistan
Venezuela, RB
Vietnam
Zambia
Zimbabwe
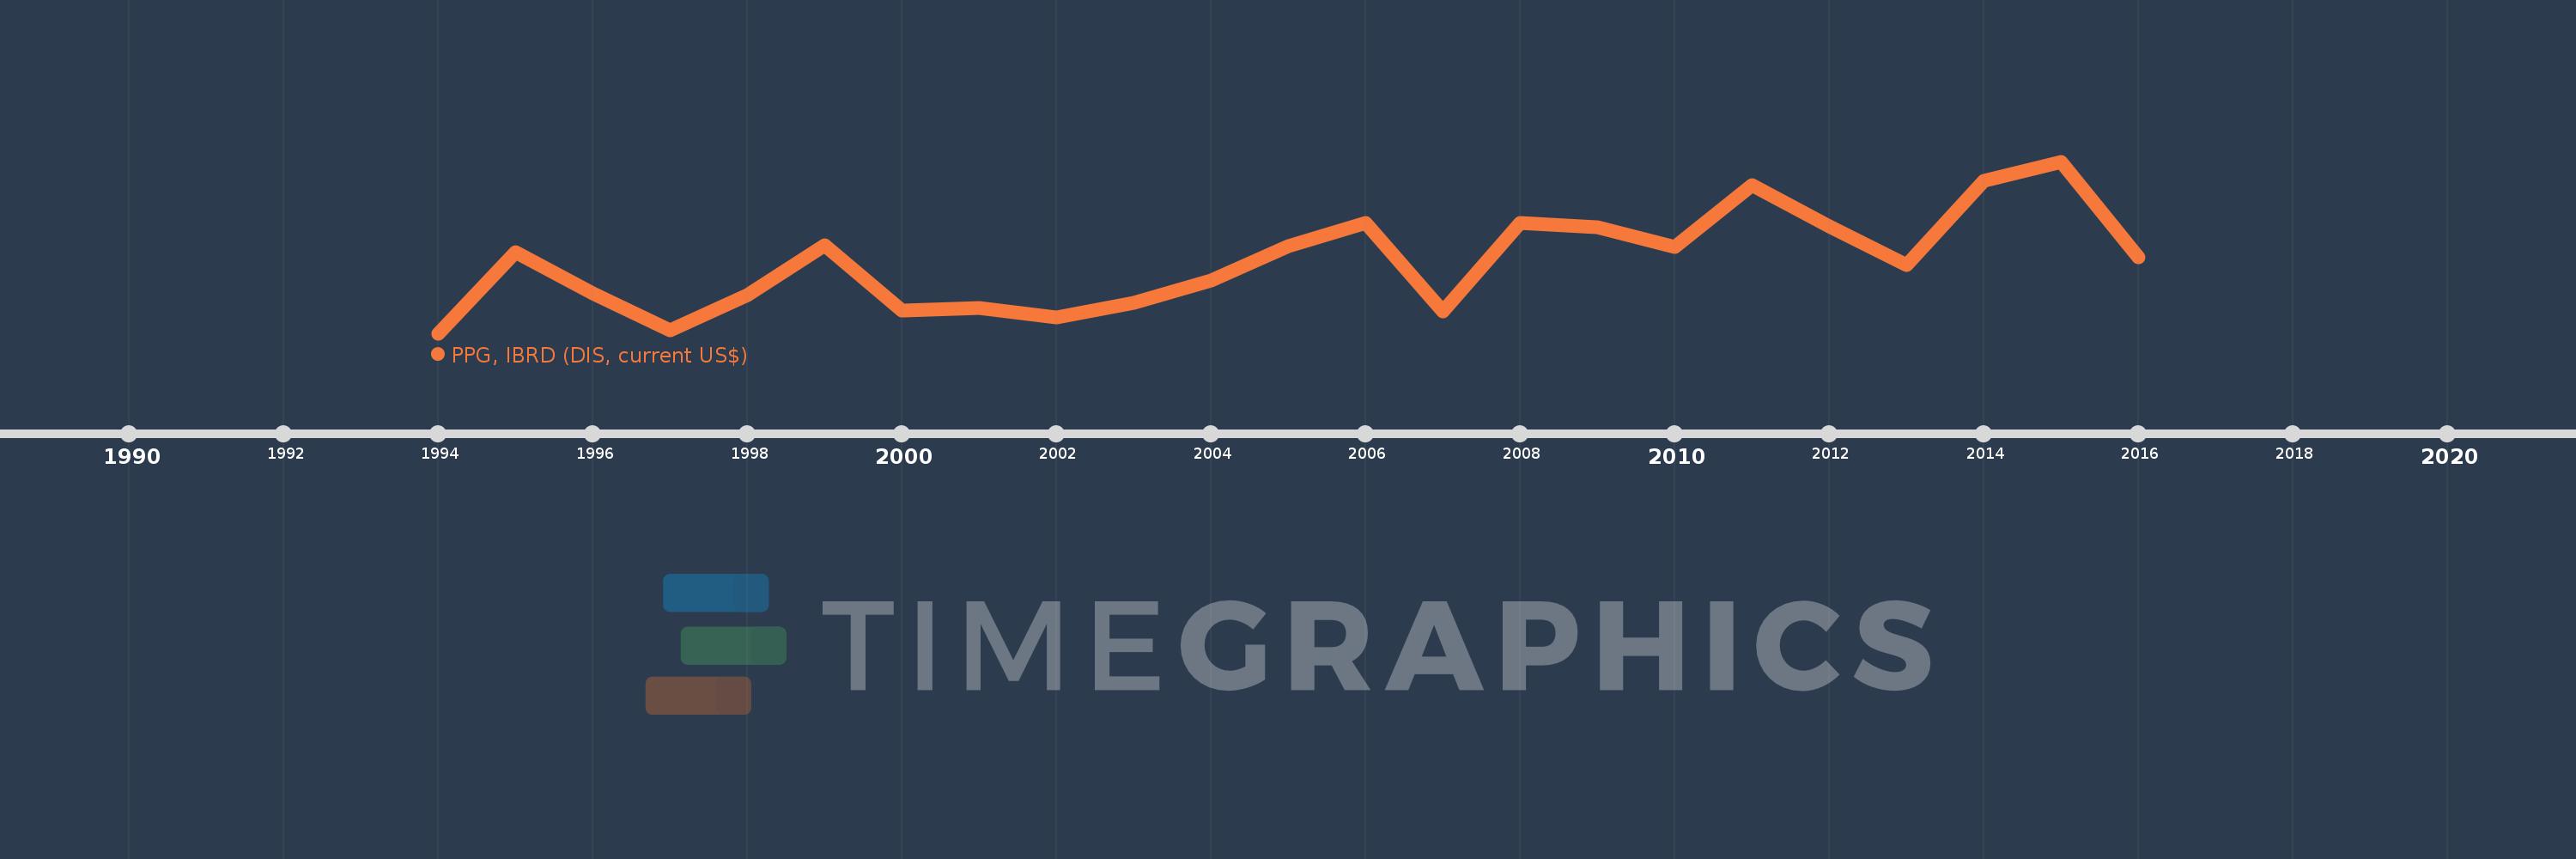
Timeline:
This timeline shows a graph from
1994
to
2016
of Macedonia, FYR. No data until
1993
. Number of actual observations by date:
23
.
Source name:
World Development Indicators
Source organization:
World Bank, International Debt Statistics.
Categories, topics:
External Debt
Last updated:
apr 23, 2017
Indicators value changes by year
Meaning:
35.321 mln
Minimum:
592.0K
jan 1, 1994
Maximum:
84.153 mln
jan 1, 2015
At the date of observation
Value
Absolute change
Change from the previous value
jan 1, 1994
592.0K
+592.0K
0.0%
jan 1, 1995
40.0 mln
+39.408 mln
6.66K%
jan 1, 1996
19.984 mln
-20.016 mln
-50.04%
jan 1, 1997
2.012 mln
-17.972 mln
-89.93%
jan 1, 1998
19.14 mln
+17.128 mln
851.29%
jan 1, 1999
43.409 mln
+24.269 mln
126.8%
jan 1, 2000
11.845 mln
-31.564 mln
-72.71%
jan 1, 2001
13.044 mln
+1.199 mln
10.12%
jan 1, 2002
8.388 mln
-4.656 mln
-35.69%
jan 1, 2003
15.439 mln
+7.051 mln
84.06%
jan 1, 2004
26.197 mln
+10.758 mln
69.68%
jan 1, 2005
42.878 mln
+16.681 mln
63.68%
jan 1, 2006
54.323 mln
+11.445 mln
26.69%
jan 1, 2007
11.382 mln
-42.941 mln
-79.05%
jan 1, 2008
54.136 mln
+42.754 mln
375.63%
jan 1, 2009
52.02 mln
-2.116 mln
-3.91%
jan 1, 2010
42.517 mln
-9.503 mln
-18.27%
jan 1, 2011
72.485 mln
+29.968 mln
70.48%
jan 1, 2012
52.447 mln
-20.038 mln
-27.64%
jan 1, 2013
33.833 mln
-18.614 mln
-35.49%
jan 1, 2014
74.649 mln
+40.816 mln
120.64%
jan 1, 2015
84.153 mln
+9.504 mln
12.73%
jan 1, 2016
37.516 mln
-46.637 mln
-55.42%
Ranking of countries by current statistics by years
About & Feedback
Terms
Privacy
FAQ
Support 24/7
Cabinet
Get premium
Donate
The service accepts bank transfer (ACH, Wire) or cards (Visa, MasterCard, etc). Processed by Stripe.
Secured with SSL