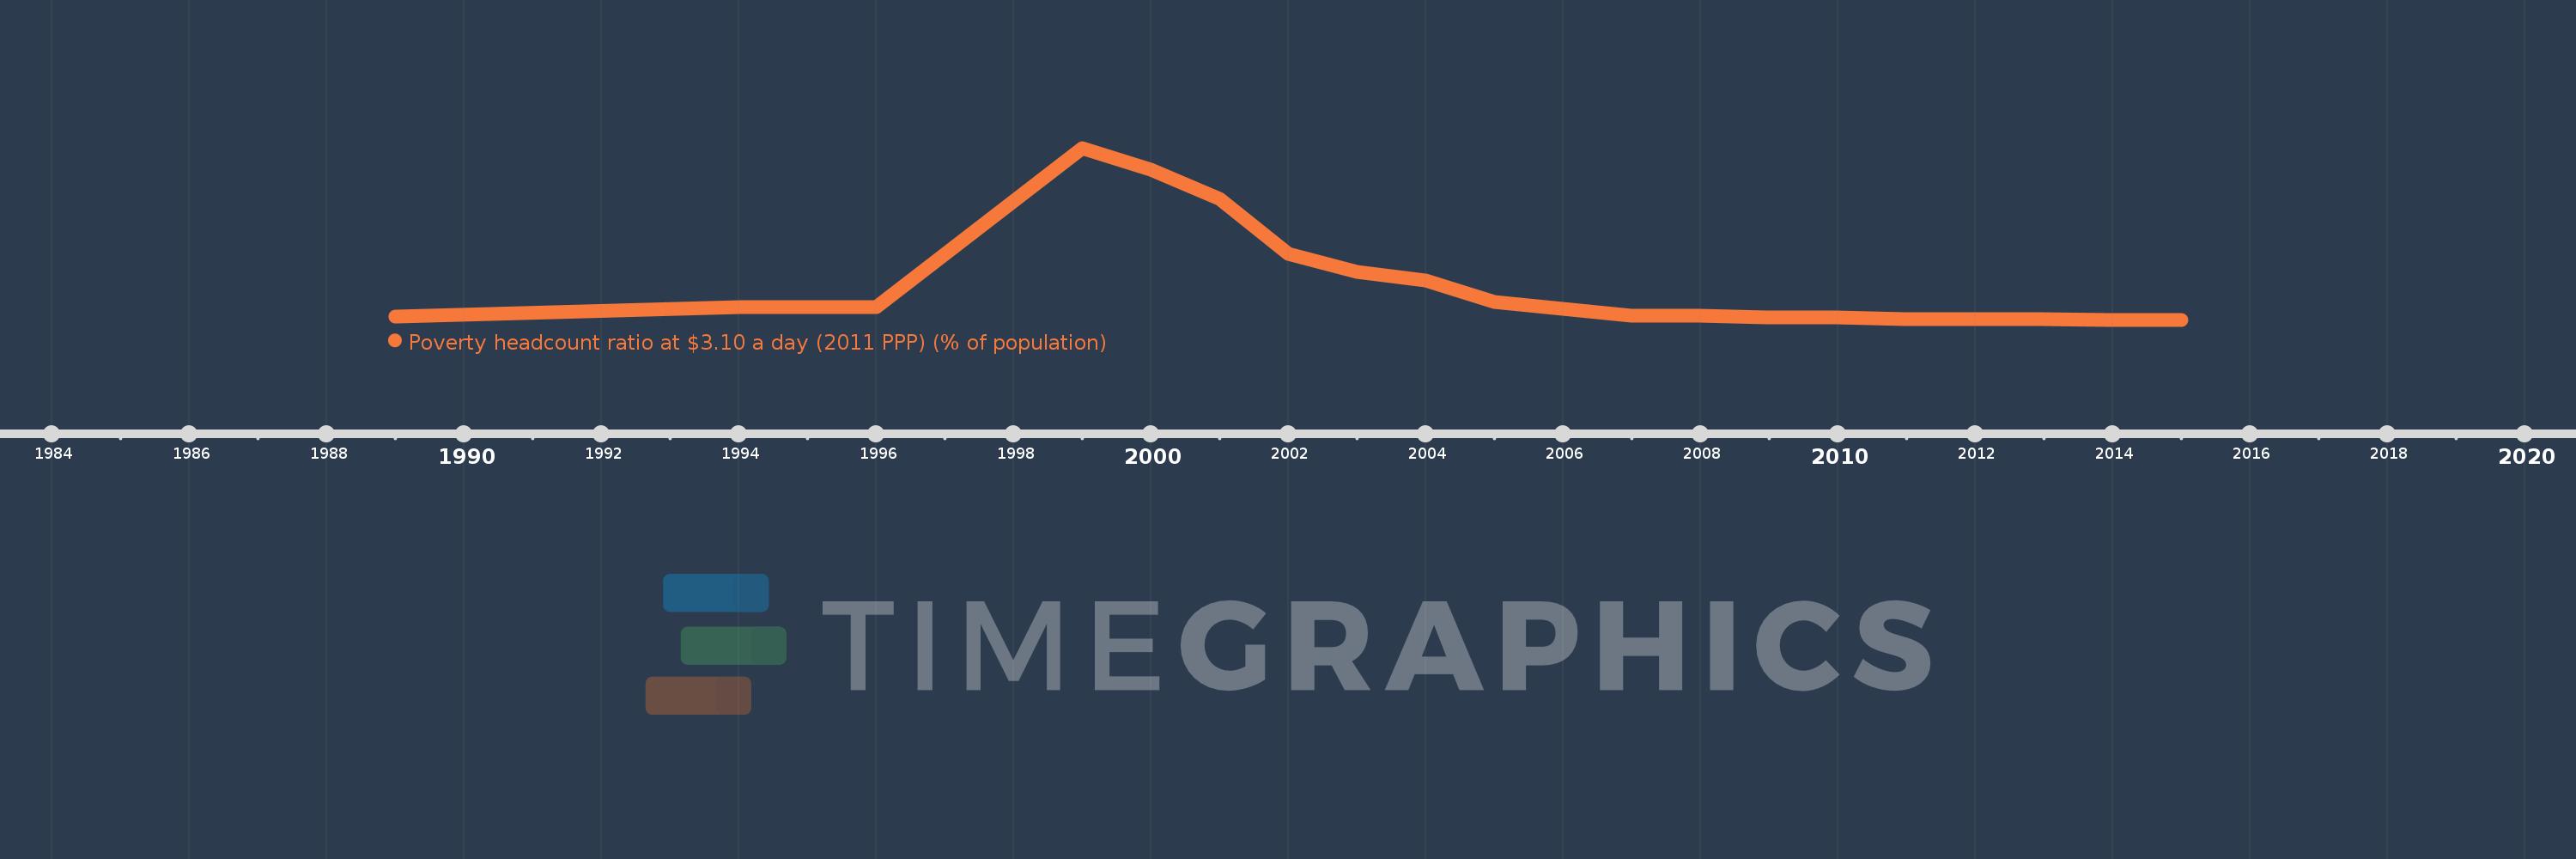
This timeline shows a graph from 1989 to 2015 of Belarus. No data until 1988. Number of actual observations by date: 20.
Source name:
World Development Indicators
Source organization:
World Bank, Development Research Group. Data are based on primary household survey data obtained from government statistical agencies and World Bank country departments. Data for high-income economies are from the Luxembourg Income Study database. For more information and methodology, please see PovcalNet (http://iresearch.worldbank.org/PovcalNet/index.htm).
Categories, topics:
Poverty
Last updated:
apr 23, 2017
Indicators value changes by year
Meaning:
7.032
Minimum:
0.0
jan 1, 2014
Maximum:
36.14
jan 1, 1999
At the date of observation
Value
Absolute change
Change from the previous value
jan 1, 1989
0.64
+0.64
0.0%
jan 1, 1994
2.7
+2.06
321.88%
jan 1, 1996
2.62
-0.08
-2.96%
jan 1, 1999
36.14
+33.52
1.28K%
jan 1, 2000
31.61
-4.53
-12.53%
jan 1, 2001
25.51
-6.1
-19.3%
jan 1, 2002
13.95
-11.56
-45.32%
jan 1, 2003
10.01
-3.94
-28.24%
jan 1, 2004
8.29
-1.72
-17.18%
jan 1, 2005
3.83
-4.46
-53.8%
jan 1, 2006
2.22
-1.61
-42.04%
jan 1, 2007
0.9
-1.32
-59.46%
jan 1, 2008
0.93
+0.03
3.33%
jan 1, 2009
0.47
-0.46
-49.46%
jan 1, 2010
0.54
+0.07
14.89%
jan 1, 2011
0.17
-0.37
-68.52%
jan 1, 2012
0.04
-0.13
-76.47%
jan 1, 2013
0.07
+0.03
75.0%
jan 1, 2014
0.0
-0.07
-100.0%
jan 1, 2015
0.0
0.0
%
Ranking of countries by current statistics by years