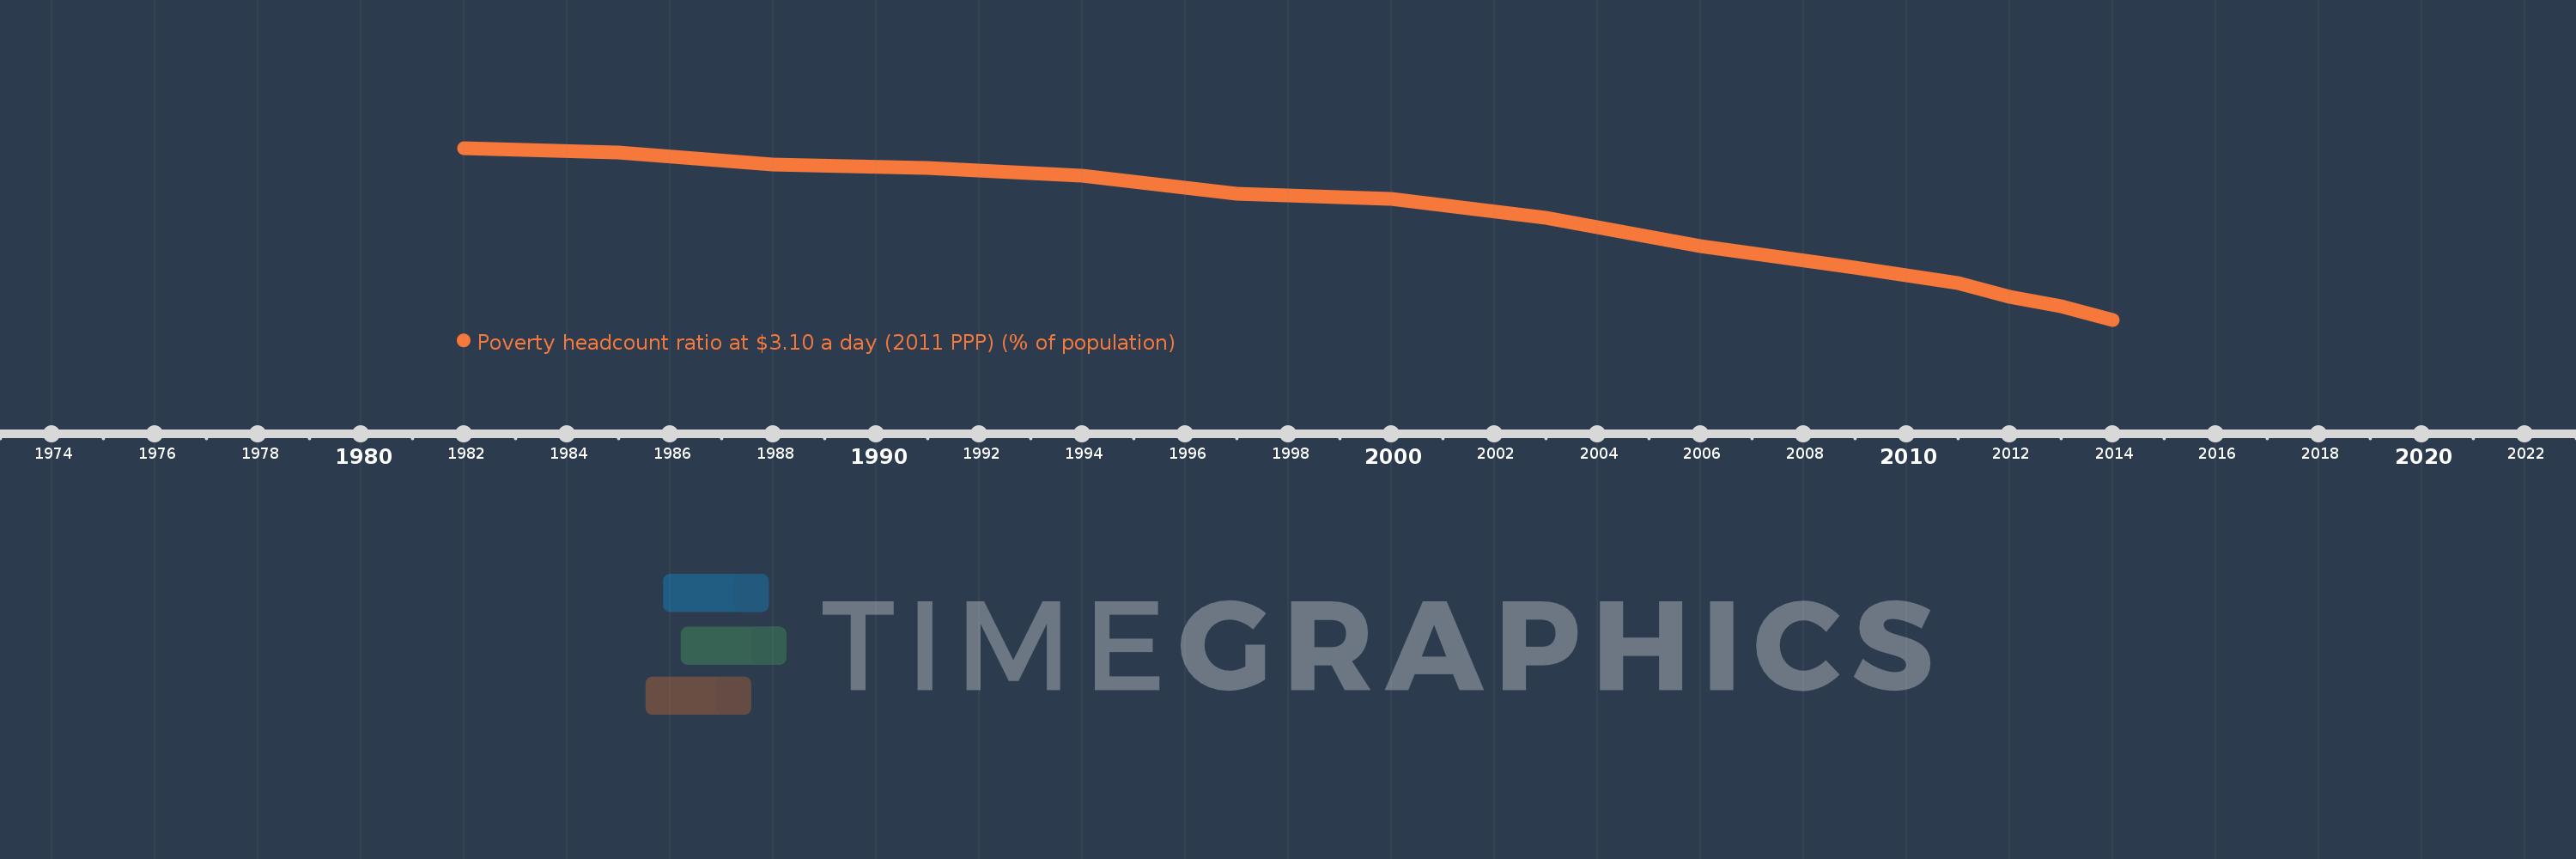
This timeline shows a graph from 1982 to 2014 of Middle income. No data until 1981. Number of actual observations by date: 14.
Source name:
World Development Indicators
Source organization:
World Bank, Development Research Group. Data are based on primary household survey data obtained from government statistical agencies and World Bank country departments. Data for high-income economies are from the Luxembourg Income Study database. For more information and methodology, please see PovcalNet (http://iresearch.worldbank.org/PovcalNet/index.htm).
Categories, topics:
Poverty
Last updated:
apr 23, 2017
Indicators value changes by year
Meaning:
52.707
Minimum:
28.92
jan 1, 2014
Maximum:
71.72
jan 1, 1982
At the date of observation
Value
Absolute change
Change from the previous value
jan 1, 1982
71.72
+71.72
0.0%
jan 1, 1985
70.63
-1.09
-1.52%
jan 1, 1988
67.53
-3.1
-4.39%
jan 1, 1991
66.69
-0.84
-1.24%
jan 1, 1994
64.75
-1.94
-2.91%
jan 1, 1997
60.25
-4.5
-6.95%
jan 1, 2000
58.96
-1.29
-2.14%
jan 1, 2003
54.31
-4.65
-7.89%
jan 1, 2006
47.18
-7.13
-13.13%
jan 1, 2009
41.97
-5.21
-11.04%
jan 1, 2011
38.02
-3.95
-9.41%
jan 1, 2012
34.6
-3.42
-9.0%
jan 1, 2013
32.37
-2.23
-6.45%
jan 1, 2014
28.92
-3.45
-10.66%
Ranking of countries by current statistics by years