33
/
AIzaSyB4mHJ5NPEv-XzF7P6NDYXjlkCWaeKw5bc
November 30, 2025
34542
Fragile and conflict affected situations
FCS
false
2
1
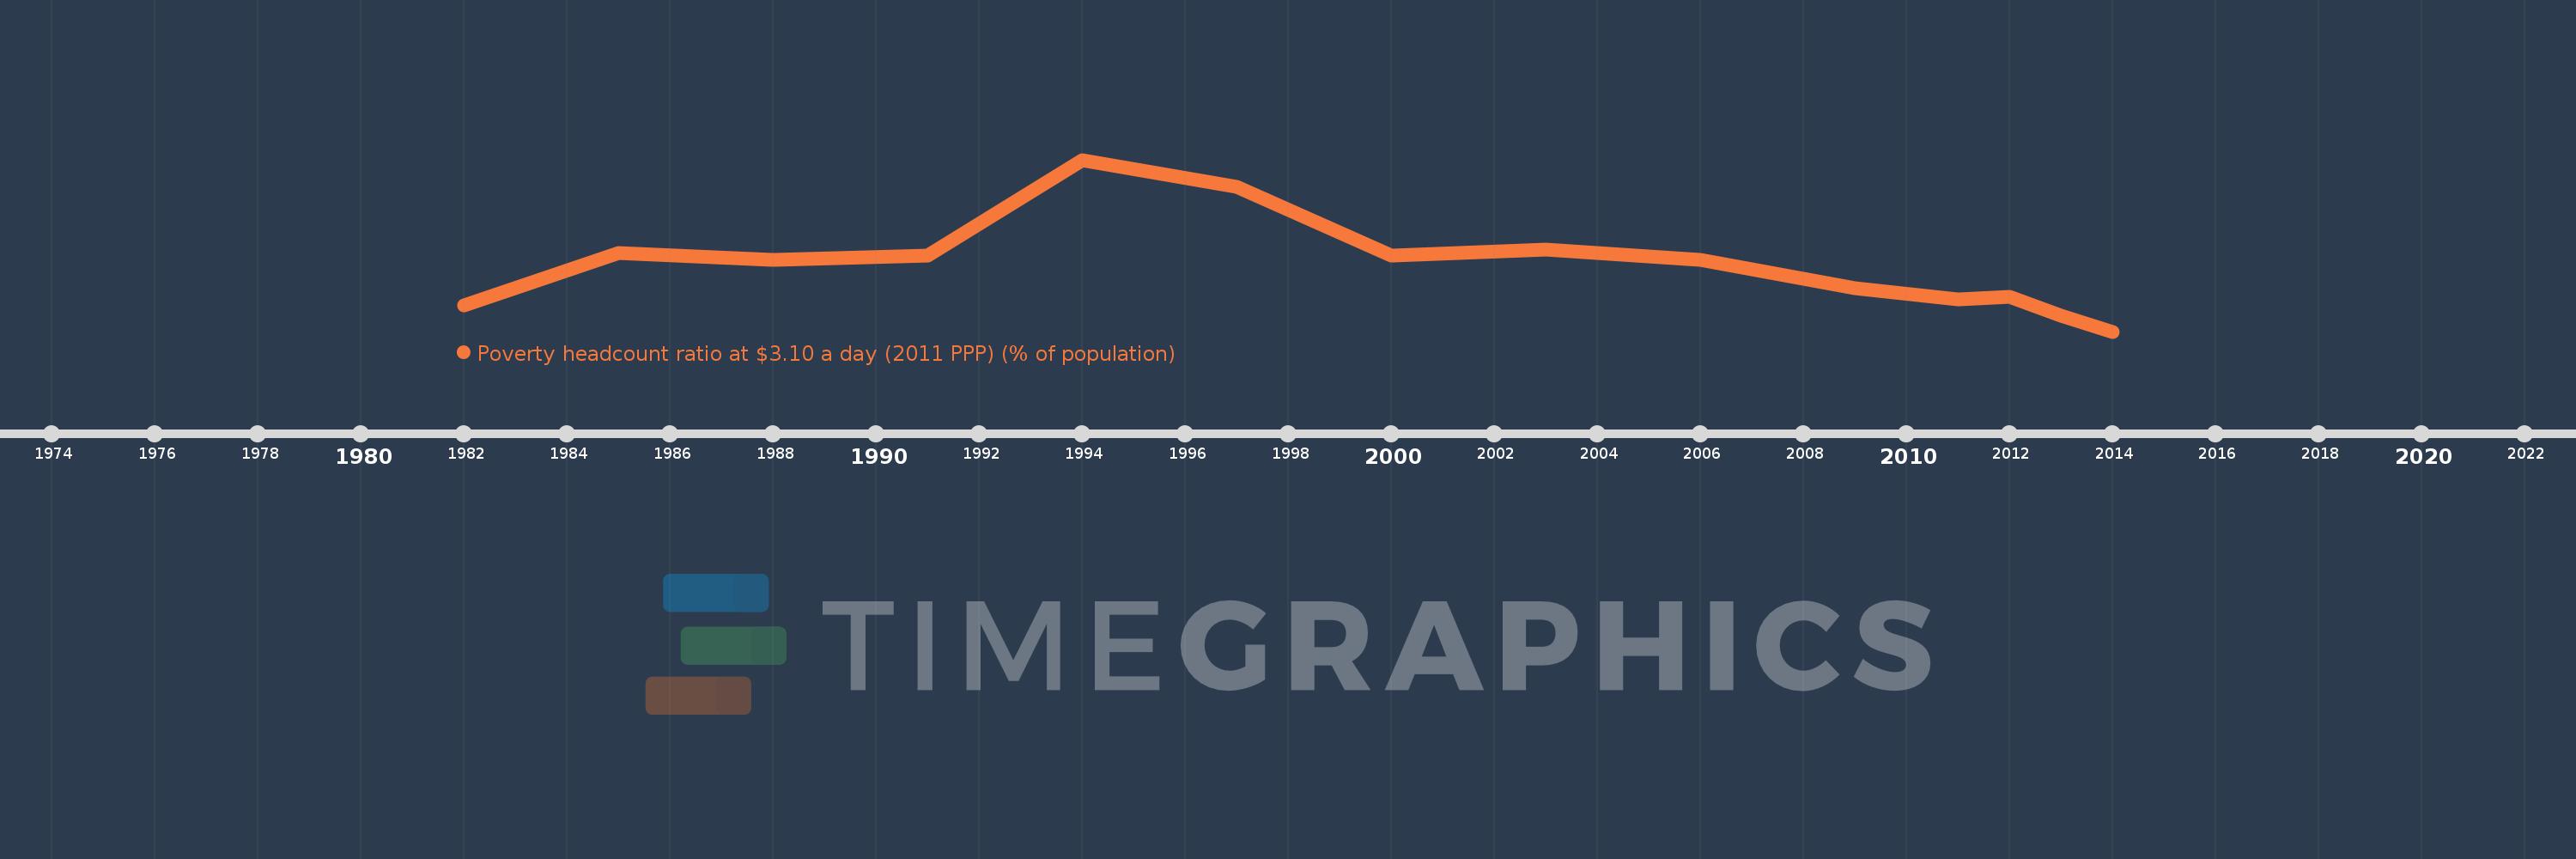
Poverty headcount ratio at $3.10 a day (2011 PPP) (% of population)
2014,2013,2012,2011,2009,2006,2003,2000,1997,1994,1991,1988,1985,1982