Download This statistics in other country:
Timeline:
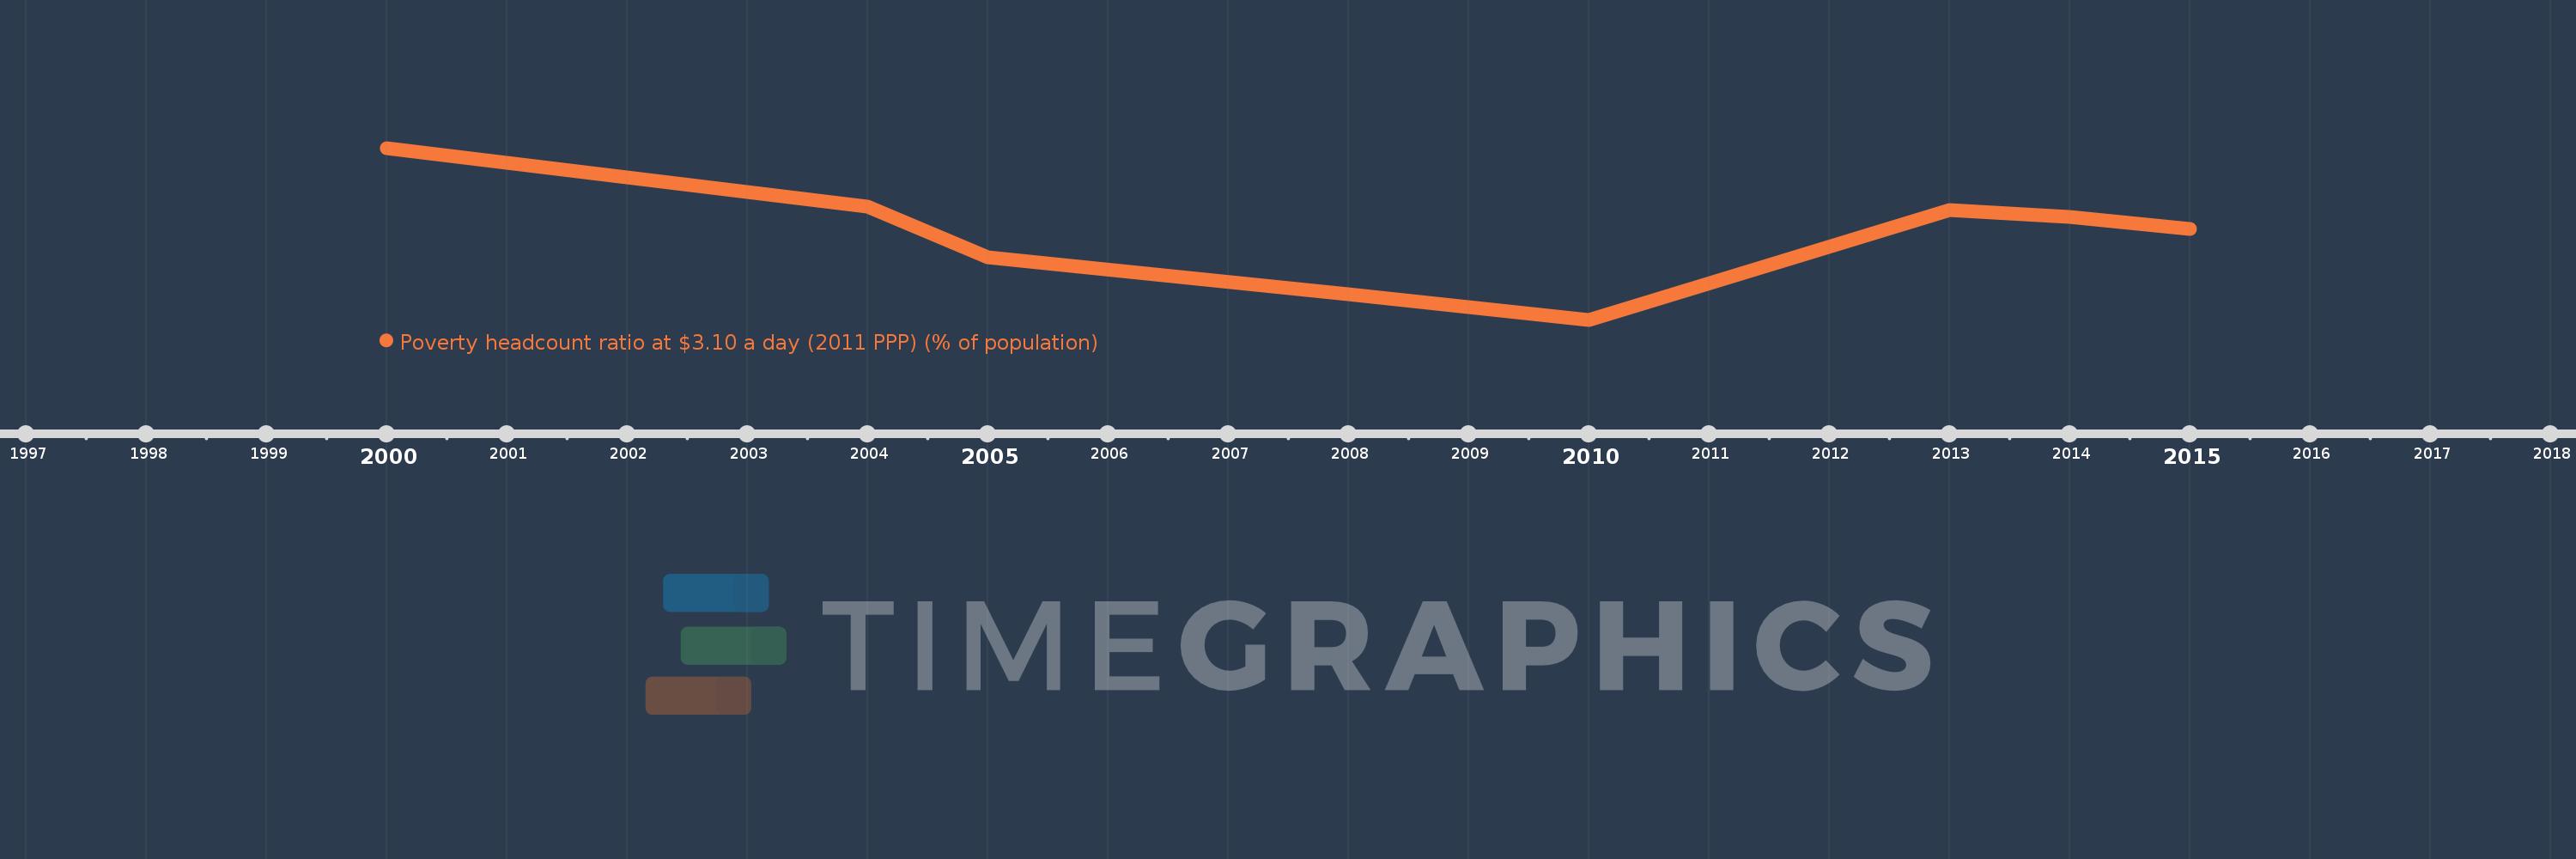
This timeline shows a graph from 2000 to 2015 of Tajikistan. No data until 1999. Number of actual observations by date: 8.
Source name:
World Development Indicators
Source organization:
World Bank, Development Research Group. Data are based on primary household survey data obtained from government statistical agencies and World Bank country departments. Data for high-income economies are from the Luxembourg Income Study database. For more information and methodology, please see PovcalNet (http://iresearch.worldbank.org/PovcalNet/index.htm).
Categories, topics:
Poverty
Last updated:
apr 23, 2017
Indicators value changes by year
At the date of observation
Value
Absolute change
Change from the previous value
jan 1, 2000
86.06
+86.06
0.0%
jan 1, 2004
64.78
-21.28
-24.73%
jan 1, 2005
46.29
-18.49
-28.54%
jan 1, 2008
32.65
-13.64
-29.47%
jan 1, 2010
23.43
-9.22
-28.24%
jan 1, 2013
63.34
+39.91
170.34%
jan 1, 2014
60.82
-2.52
-3.98%
jan 1, 2015
56.67
-4.15
-6.82%
Ranking of countries by current statistics by years