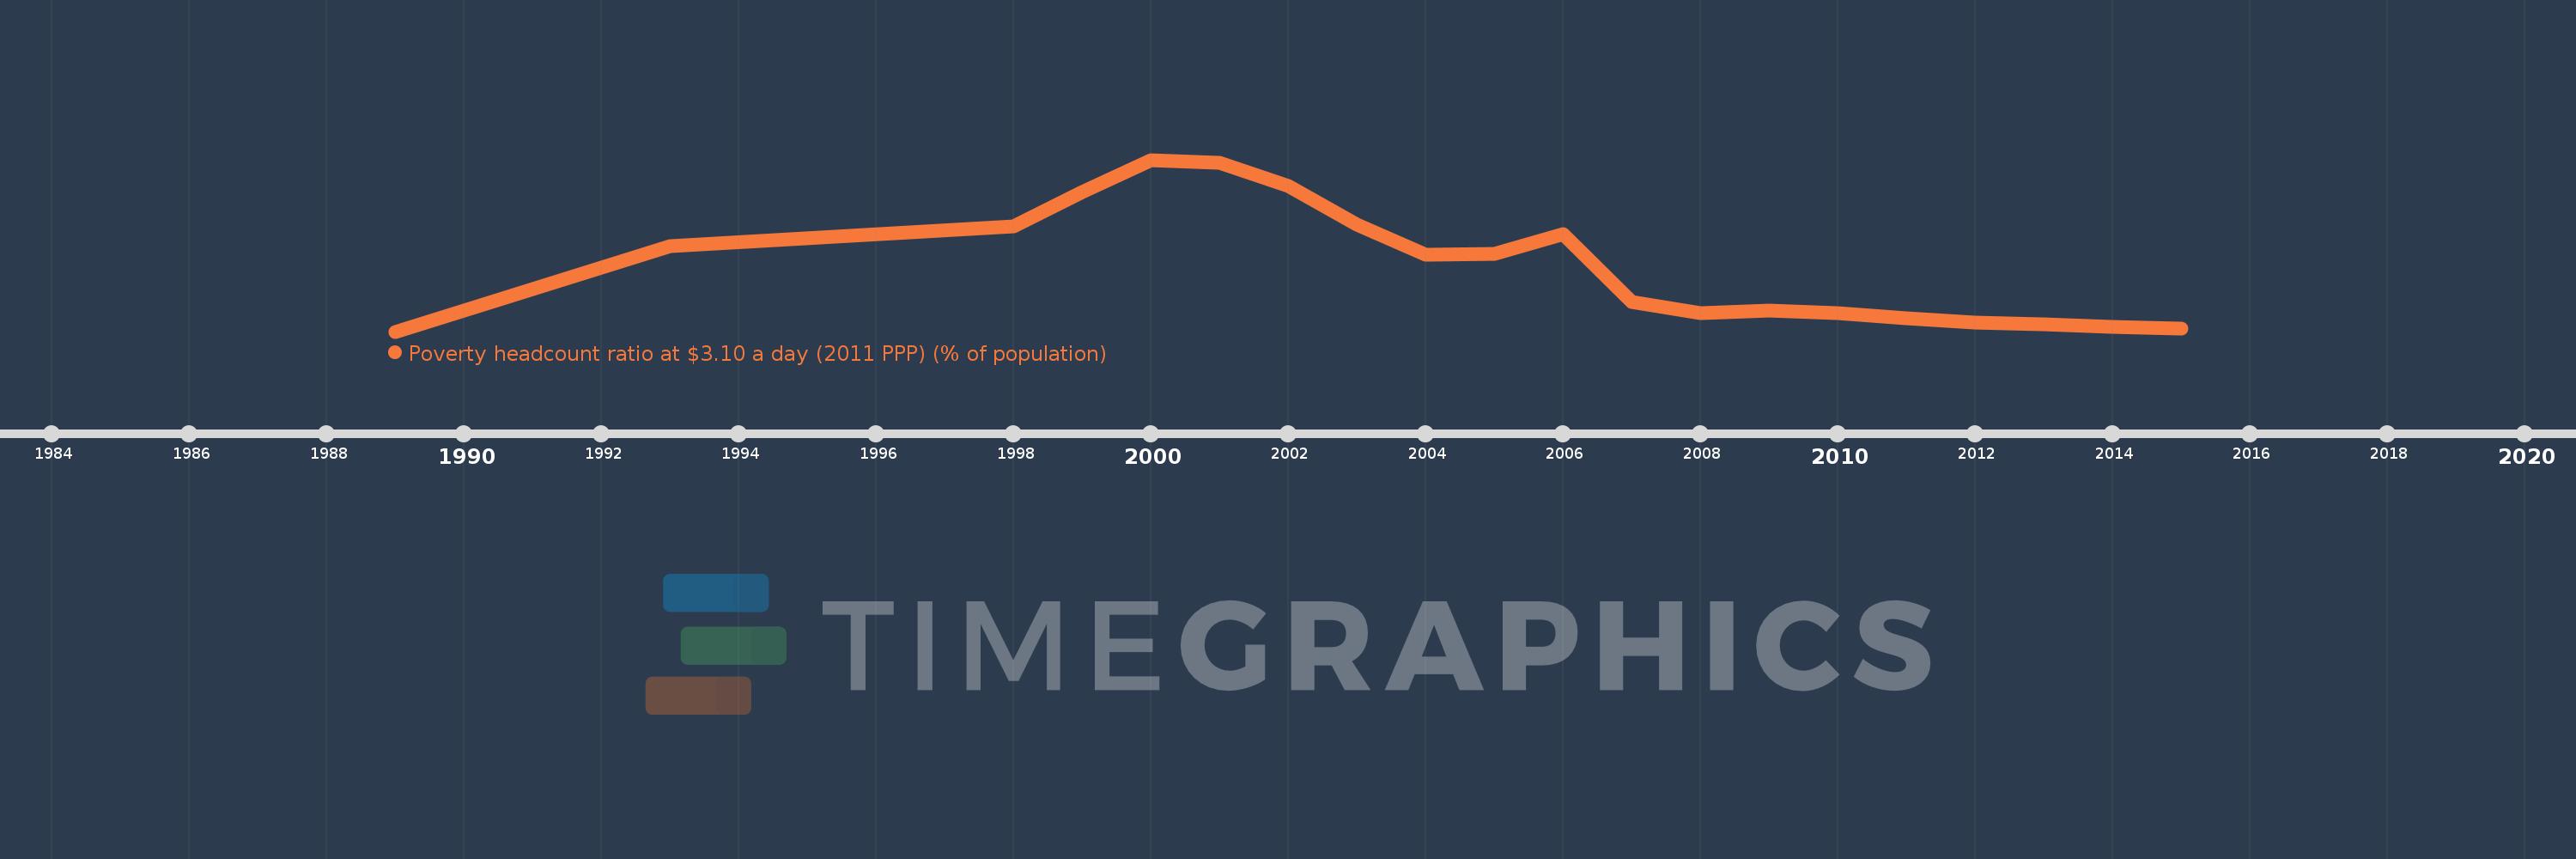
This timeline shows a graph from 1989 to 2015 of Moldova. No data until 1988. Number of actual observations by date: 20.
Source name:
World Development Indicators
Source organization:
World Bank, Development Research Group. Data are based on primary household survey data obtained from government statistical agencies and World Bank country departments. Data for high-income economies are from the Luxembourg Income Study database. For more information and methodology, please see PovcalNet (http://iresearch.worldbank.org/PovcalNet/index.htm).
Categories, topics:
Poverty
Last updated:
apr 23, 2017
Indicators value changes by year
Meaning:
25.84
Minimum:
0.0
jan 1, 1989
Maximum:
68.35
jan 1, 2000
At the date of observation
Value
Absolute change
Change from the previous value
jan 1, 1989
0.0
0.0
0.0%
jan 1, 1993
33.86
+33.86
%
jan 1, 1998
41.99
+8.13
24.01%
jan 1, 1999
55.69
+13.7
32.63%
jan 1, 2000
68.35
+12.66
22.73%
jan 1, 2001
67.14
-1.21
-1.77%
jan 1, 2002
57.87
-9.27
-13.81%
jan 1, 2003
42.59
-15.28
-26.4%
jan 1, 2004
30.45
-12.14
-28.5%
jan 1, 2005
30.85
+0.4
1.31%
jan 1, 2006
38.67
+7.82
25.35%
jan 1, 2007
11.74
-26.93
-69.64%
jan 1, 2008
7.27
-4.47
-38.07%
jan 1, 2009
8.31
+1.04
14.31%
jan 1, 2010
7.43
-0.88
-10.59%
jan 1, 2011
5.19
-2.24
-30.15%
jan 1, 2012
3.54
-1.65
-31.79%
jan 1, 2013
2.88
-0.66
-18.64%
jan 1, 2014
1.95
-0.93
-32.29%
jan 1, 2015
1.03
-0.92
-47.18%
Ranking of countries by current statistics by years