33
/
AIzaSyB4mHJ5NPEv-XzF7P6NDYXjlkCWaeKw5bc
November 30, 2025
77419
Bahrain
BHR
true
2
1
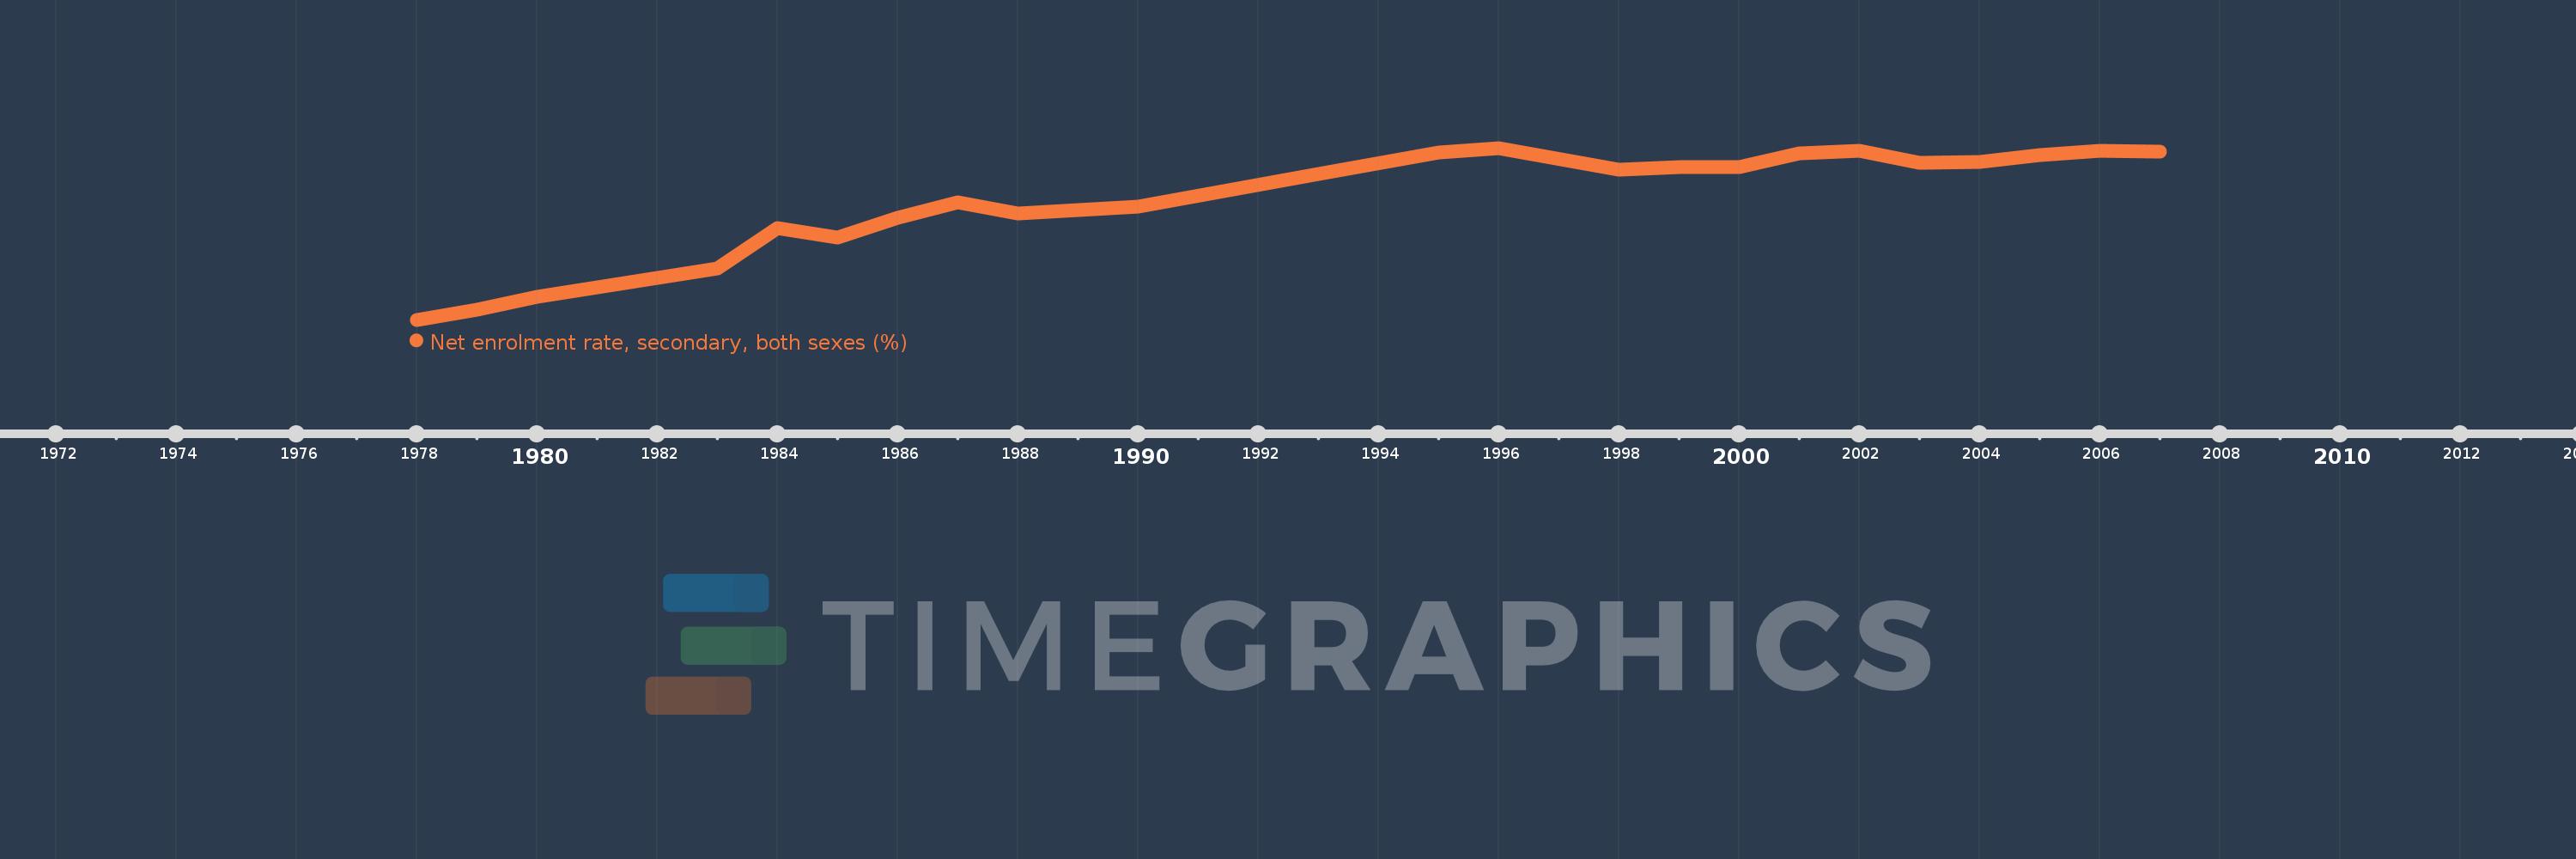
Net enrolment rate, secondary, both sexes (%)
2007,2006,2005,2004,2003,2002,2001,2000,1999,1998,1996,1995,1993,1990,1988,1987,1986,1985,1984,1983,1980,1979,1978