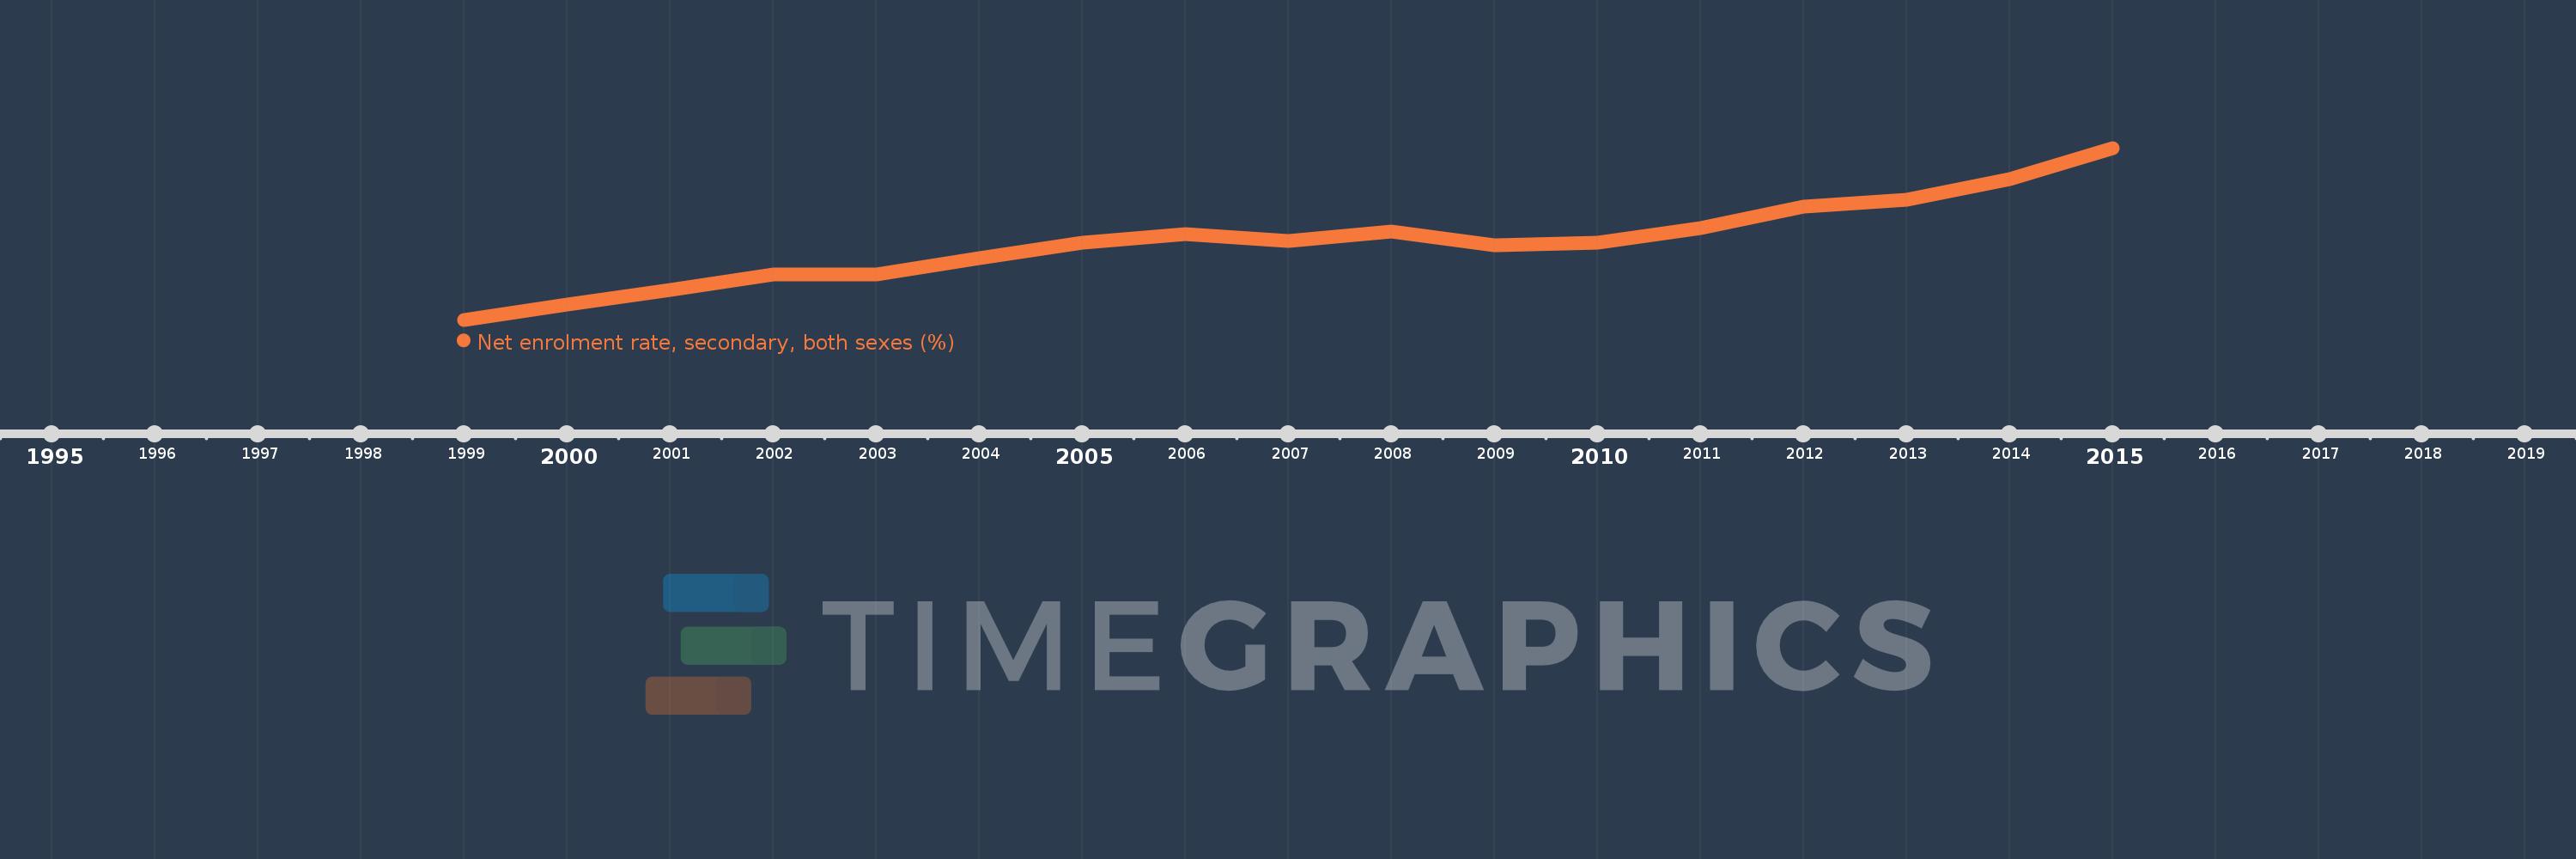
This timeline shows a graph from 1999 to 2015 of East Asia & Pacific (excluding high income). No data until 1998. Number of actual observations by date: 17.
Source name:
World Development Indicators
Source organization:
UNESCO Institute for Statistics
Categories, topics:
Education
Last updated:
apr 23, 2017
Indicators value changes by year
Meaning:
67.548
Minimum:
60.959
jan 1, 1999
Maximum:
75.591
jan 1, 2015
At the date of observation
Value
Absolute change
Change from the previous value
jan 1, 1999
60.959
+60.959
0.0%
jan 1, 2000
62.263
+1.303
2.14%
jan 1, 2001
63.489
+1.227
1.97%
jan 1, 2002
64.819
+1.33
2.09%
jan 1, 2003
64.851
+0.032
0.05%
jan 1, 2004
66.23
+1.379
2.13%
jan 1, 2005
67.521
+1.291
1.95%
jan 1, 2006
68.217
+0.696
1.03%
jan 1, 2007
67.704
-0.513
-0.75%
jan 1, 2008
68.454
+0.75
1.11%
jan 1, 2009
67.274
-1.18
-1.72%
jan 1, 2010
67.495
+0.222
0.33%
jan 1, 2011
68.73
+1.235
1.83%
jan 1, 2012
70.583
+1.853
2.7%
jan 1, 2013
71.203
+0.62
0.88%
jan 1, 2014
72.929
+1.726
2.42%
jan 1, 2015
75.591
+2.662
3.65%
Ranking of countries by current statistics by years