33
/
AIzaSyAYiBZKx7MnpbEhh9jyipgxe19OcubqV5w
August 1, 2025
32889
Europe & Central Asia (IDA & IBRD countries)
TEC
false
2
1
Net enrolment rate, secondary, both sexes (%)
2015,2014,2013,2012,2011,2010,2009,2008,2007,2006,2005,2004,2003,2002,2001,2000,1999
Download
Global statistics library →Europe & Central Asia (IDA & IBRD countries) →

Net enrolment rate, secondary, both sexes (%)

This statistics in other country:

AfghanistanAlbaniaAlgeriaAngolaAntigua and BarbudaArab WorldArgentinaArmeniaArubaAustraliaAustriaAzerbaijanBahamas, TheBahrainBangladeshBarbadosBelarusBelgiumBelizeBeninBermudaBhutanBoliviaBotswanaBrazilBritish Virgin IslandsBrunei DarussalamBulgariaBurkina FasoBurundiCabo VerdeCambodiaCameroonCanadaCaribbean small statesCentral African RepublicCentral Europe and the BalticsChadChileColombiaComorosCongo, Dem. Rep.Congo, Rep.Costa RicaCroatiaCubaCyprusDenmarkDjiboutiDominicaDominican RepublicEarly-demographic dividendEast Asia & PacificEast Asia & Pacific (excluding high income)East Asia & Pacific (IDA & IBRD countries)EcuadorEgypt, Arab Rep.El SalvadorEquatorial GuineaEritreaEstoniaEthiopiaEuro areaEurope & Central AsiaEurope & Central Asia (excluding high income)Europe & Central Asia (IDA & IBRD countries)European UnionFijiFinlandFragile and conflict affected situationsFranceGambia, TheGeorgiaGhanaGreeceGrenadaGuatemalaGuineaGuinea-BissauGuyanaHeavily indebted poor countries (HIPC)High incomeHondurasHong Kong SAR, ChinaHungaryIBRD onlyIcelandIDA & IBRD totalIDA blendIDA onlyIDA totalIndiaIndonesiaIran, Islamic Rep.IraqIrelandIsraelItalyJamaicaJapanJordanKazakhstanKenyaKiribatiKorea, Dem. People’s Rep.Korea, Rep.KuwaitKyrgyz RepublicLao PDRLate-demographic dividendLatin America & Caribbean Latin America & Caribbean (excluding high income)Latin America & the Caribbean (IDA & IBRD countries)LatviaLeast developed countries: UN classificationLebanonLesothoLibyaLiechtensteinLithuaniaLow & middle incomeLow incomeLower middle incomeLuxembourgMacao SAR, ChinaMacedonia, FYRMadagascarMalawiMalaysiaMaldivesMaliMaltaMarshall IslandsMauritaniaMauritiusMexicoMiddle East & North AfricaMiddle East & North Africa (excluding high income)Middle East & North Africa (IDA & IBRD countries)Middle incomeMoldovaMongoliaMoroccoMozambiqueMyanmarNamibiaNauruNepalNetherlandsNew ZealandNicaraguaNigerNorth AmericaNorwayOECD membersOmanOther small statesPacific island small statesPakistanPanamaParaguayPeruPhilippinesPolandPortugalPost-demographic dividendPre-demographic dividendPuerto RicoQatarRomaniaSamoaSao Tome and PrincipeSaudi ArabiaSenegalSerbiaSeychellesSierra LeoneSloveniaSmall statesSolomon IslandsSomaliaSouth AfricaSouth AsiaSouth Asia (IDA & IBRD)SpainSri LankaSt. Kitts and NevisSt. LuciaSt. Vincent and the GrenadinesSub-Saharan Africa Sub-Saharan Africa (excluding high income)Sub-Saharan Africa (IDA & IBRD countries)SurinameSwazilandSwedenSwitzerlandSyrian Arab RepublicTajikistanThailandTimor-LesteTogoTongaTrinidad and TobagoTunisiaTurkeyTuvaluUgandaUkraineUnited Arab EmiratesUnited KingdomUnited StatesUpper middle incomeUruguayVanuatuVenezuela, RBVietnamWest Bank and GazaWorldYemen, Rep.Zimbabwe

Timeline:

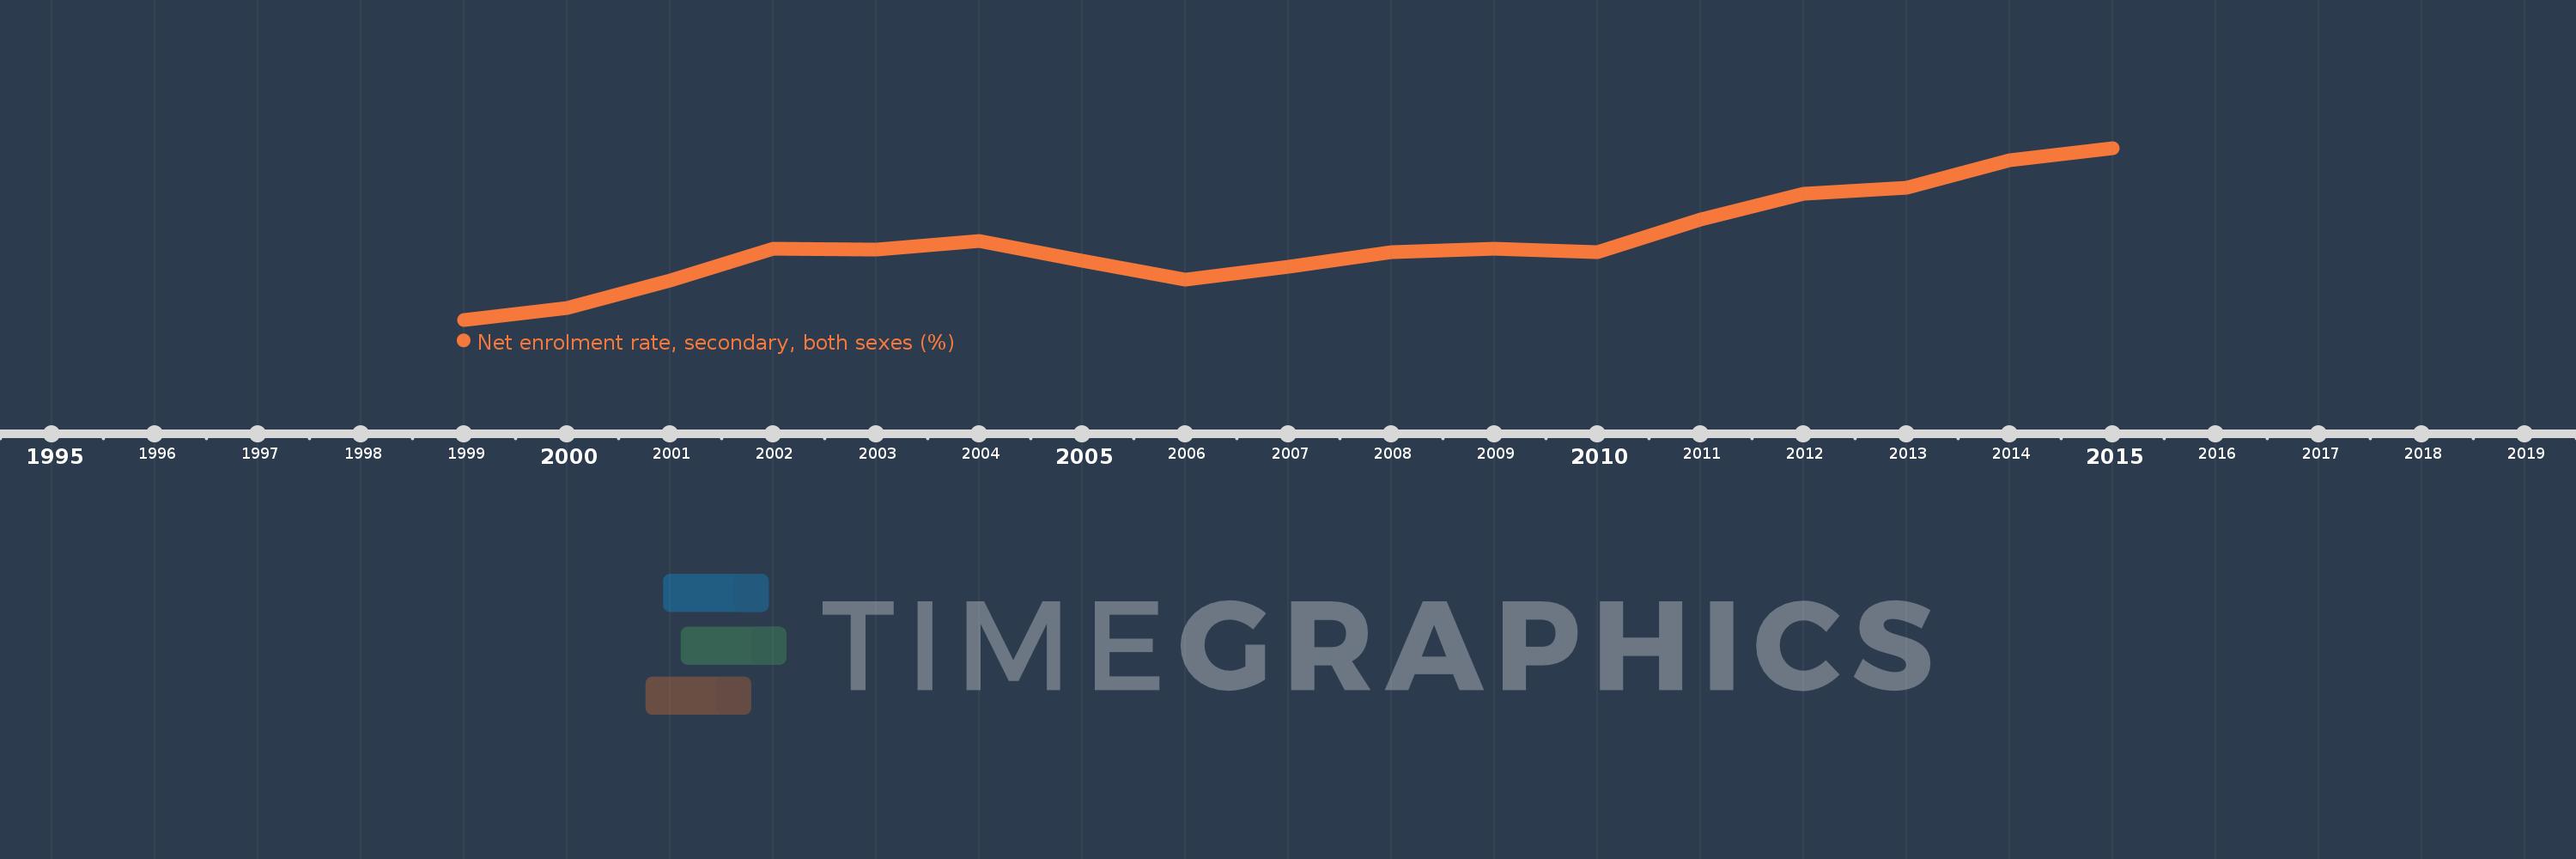
This timeline shows a graph from 1999 to 2015 of Europe & Central Asia (IDA & IBRD countries). No data until 1998. Number of actual observations by date: 17.

Source name:

World Development Indicators

Source organization:

UNESCO Institute for Statistics

Categories, topics:

Education

Last updated:

apr 23, 2017

Indicators value changes by year

Meaning:
83.19
Minimum:
79.075
jan 1, 1999
Maximum:
88.182
jan 1, 2015
At the date of observation
Value
Absolute change
Change from the previous value
jan 1, 1999
79.075
+79.075
0.0%
jan 1, 2000
79.712
+0.637
0.81%
jan 1, 2001
81.177
+1.465
1.84%
jan 1, 2002
82.82
+1.642
2.02%
jan 1, 2003
82.773
-0.047
-0.06%
jan 1, 2004
83.263
+0.49
0.59%
jan 1, 2005
82.2
-1.063
-1.28%
jan 1, 2006
81.221
-0.979
-1.19%
jan 1, 2007
81.889
+0.668
0.82%
jan 1, 2008
82.655
+0.765
0.93%
jan 1, 2009
82.849
+0.195
0.24%
jan 1, 2010
82.674
-0.175
-0.21%
jan 1, 2011
84.383
+1.709
2.07%
jan 1, 2012
85.734
+1.351
1.6%
jan 1, 2013
86.074
+0.34
0.4%
jan 1, 2014
87.549
+1.475
1.71%
jan 1, 2015
88.182
+0.633
0.72%

Ranking of countries by current statistics by years