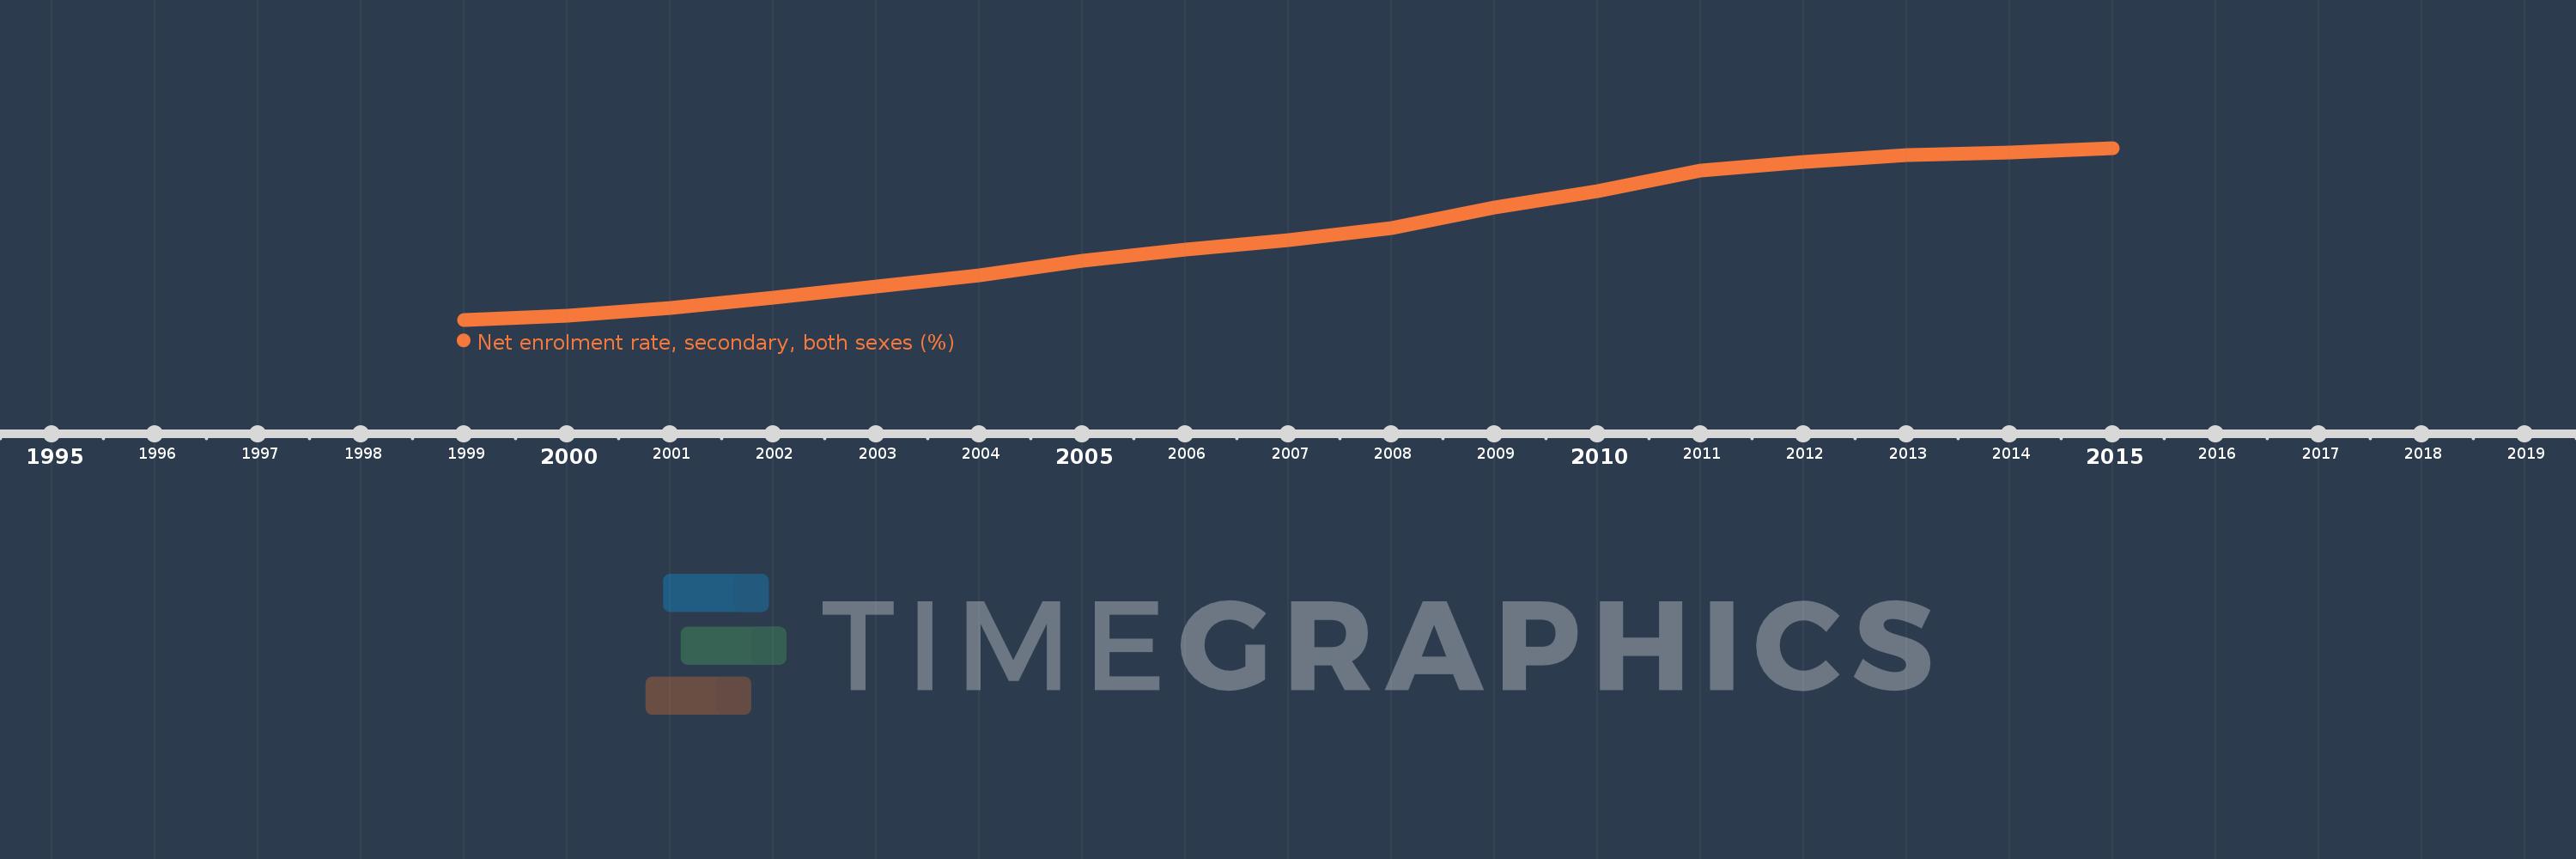
This timeline shows a graph from 1999 to 2015 of Sub-Saharan Africa (excluding high income). No data until 1998. Number of actual observations by date: 17.
Source name:
World Development Indicators
Source organization:
UNESCO Institute for Statistics
Categories, topics:
Education
Last updated:
apr 23, 2017
Indicators value changes by year
Meaning:
26.581
Minimum:
19.731
jan 1, 1999
Maximum:
33.372
jan 1, 2015
At the date of observation
Value
Absolute change
Change from the previous value
jan 1, 1999
19.731
+19.731
0.0%
jan 1, 2000
20.03
+0.299
1.52%
jan 1, 2001
20.696
+0.666
3.33%
jan 1, 2002
21.455
+0.759
3.67%
jan 1, 2003
22.37
+0.915
4.26%
jan 1, 2004
23.247
+0.877
3.92%
jan 1, 2005
24.412
+1.165
5.01%
jan 1, 2006
25.301
+0.89
3.64%
jan 1, 2007
26.071
+0.77
3.04%
jan 1, 2008
26.982
+0.911
3.49%
jan 1, 2009
28.616
+1.634
6.06%
jan 1, 2010
29.949
+1.333
4.66%
jan 1, 2011
31.559
+1.61
5.38%
jan 1, 2012
32.236
+0.677
2.14%
jan 1, 2013
32.839
+0.603
1.87%
jan 1, 2014
33.012
+0.173
0.53%
jan 1, 2015
33.372
+0.36
1.09%
Ranking of countries by current statistics by years