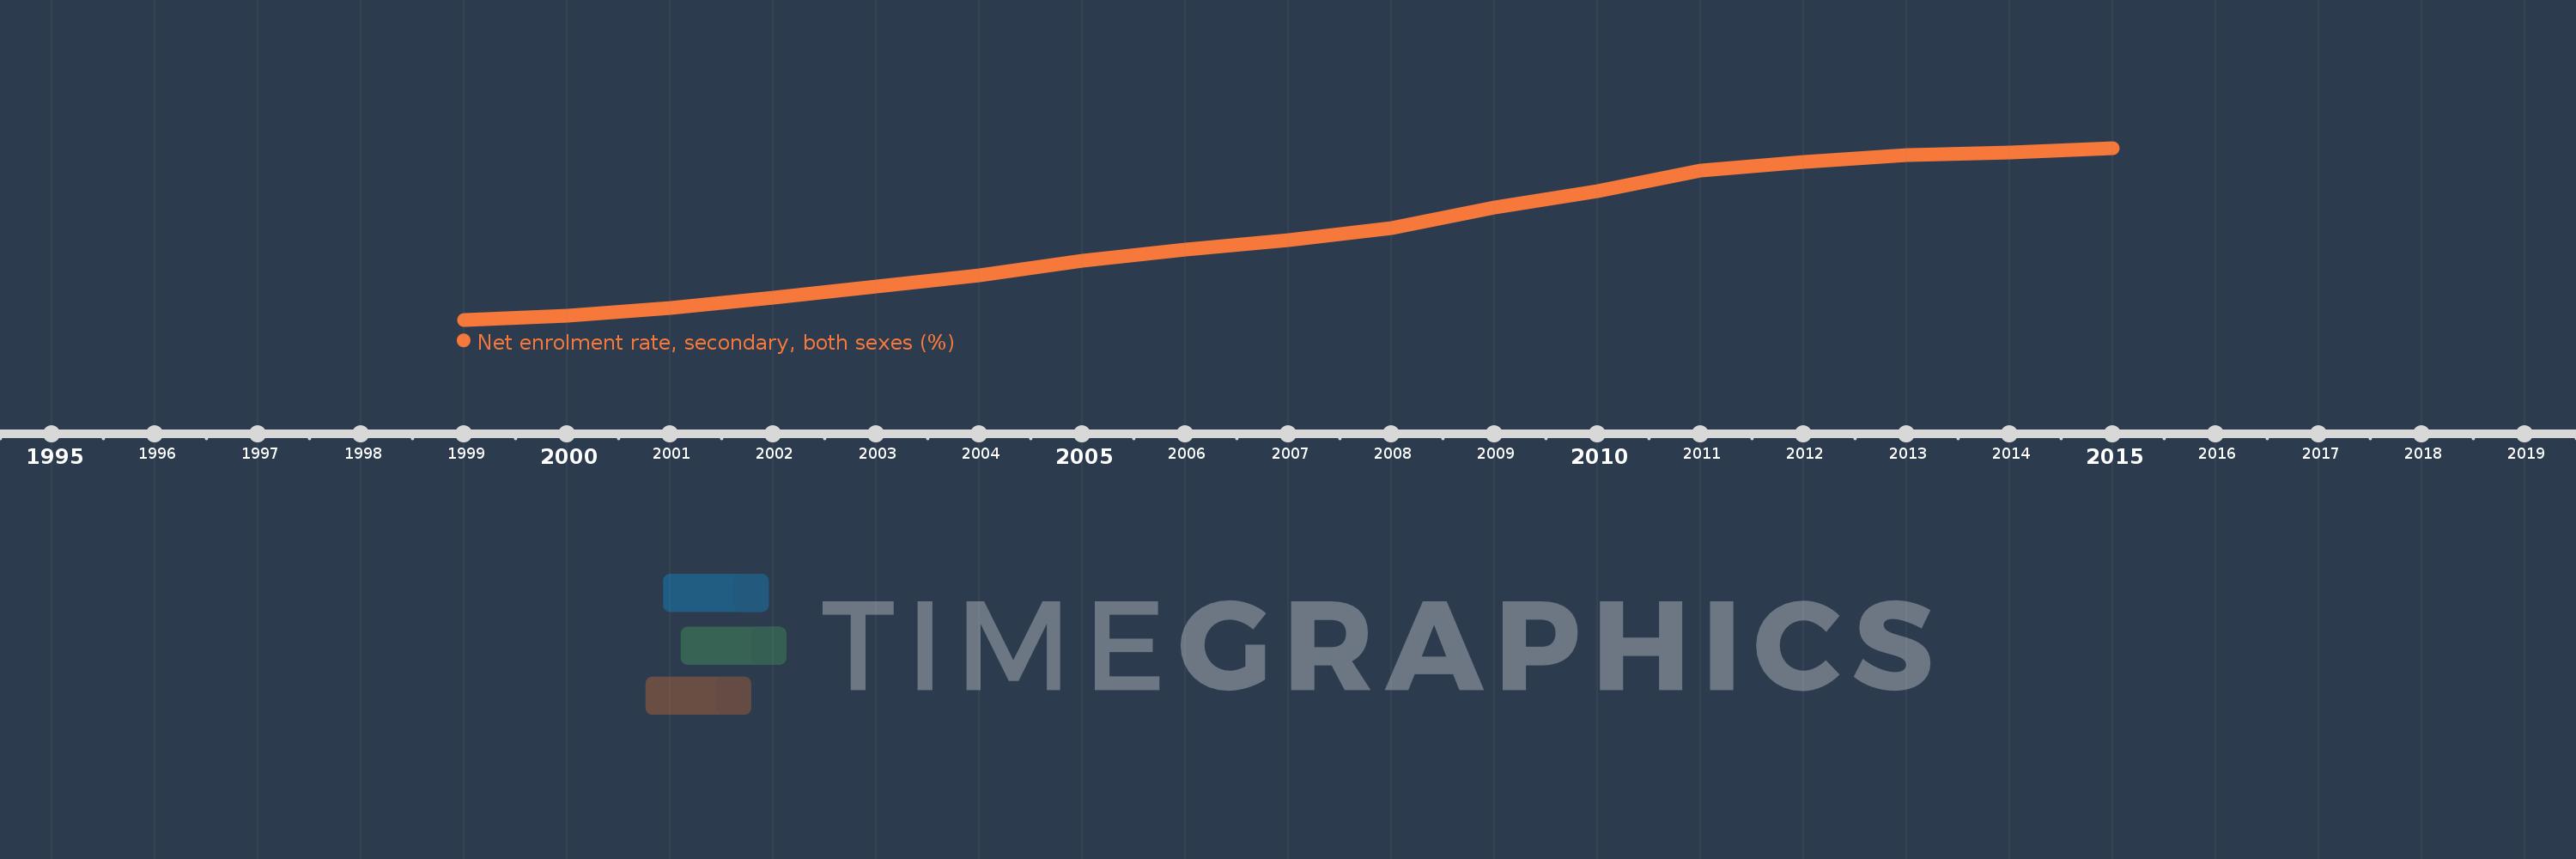
This timeline shows a graph from 1999 to 2015 of Sub-Saharan Africa (IDA & IBRD countries). No data until 1998. Number of actual observations by date: 17.
Source name:
World Development Indicators
Source organization:
UNESCO Institute for Statistics
Categories, topics:
Education
Last updated:
apr 23, 2017
Indicators value changes by year
Meaning:
26.586
Minimum:
19.737
jan 1, 1999
Maximum:
33.375
jan 1, 2015
At the date of observation
Value
Absolute change
Change from the previous value
jan 1, 1999
19.737
+19.737
0.0%
jan 1, 2000
20.036
+0.299
1.51%
jan 1, 2001
20.701
+0.666
3.32%
jan 1, 2002
21.461
+0.76
3.67%
jan 1, 2003
22.376
+0.915
4.26%
jan 1, 2004
23.252
+0.877
3.92%
jan 1, 2005
24.417
+1.164
5.01%
jan 1, 2006
25.307
+0.89
3.65%
jan 1, 2007
26.076
+0.769
3.04%
jan 1, 2008
26.986
+0.91
3.49%
jan 1, 2009
28.62
+1.634
6.05%
jan 1, 2010
29.953
+1.333
4.66%
jan 1, 2011
31.563
+1.61
5.37%
jan 1, 2012
32.24
+0.677
2.14%
jan 1, 2013
32.843
+0.603
1.87%
jan 1, 2014
33.015
+0.172
0.52%
jan 1, 2015
33.375
+0.36
1.09%
Ranking of countries by current statistics by years