Download This statistics in other country:
Timeline:
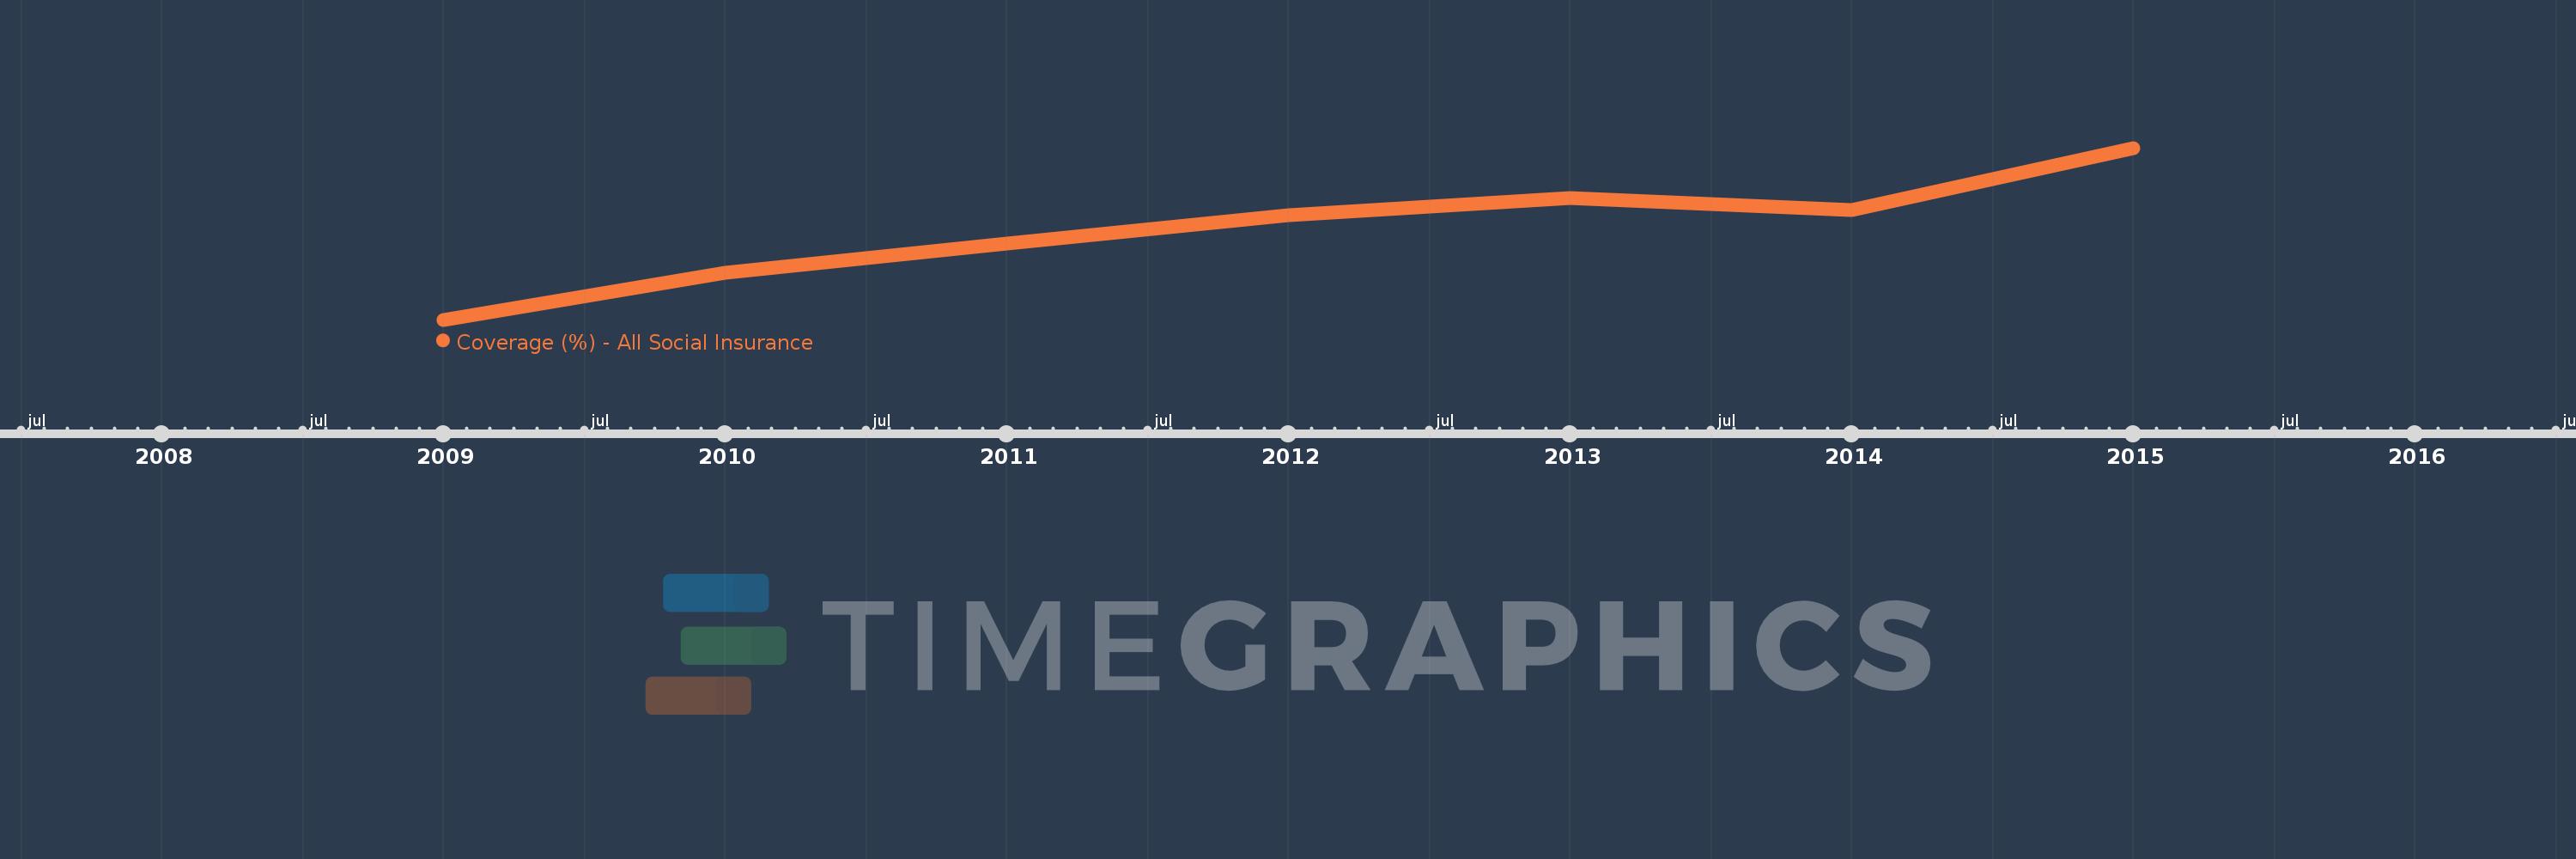
This timeline shows a graph from 2009 to 2015 of Armenia. No data until 2008. Number of actual observations by date: 7.
Source name:
World Development Indicators
Source organization:
The Atlas of Social Protection: Indicators of Resilience and Equity (ASPIRE)
Categories, topics:
Social Protection & Labor
Last updated:
apr 23, 2017
Indicators value changes by year
Minimum:
49.991
jan 1, 2009
Maximum:
54.751
jan 1, 2015
At the date of observation
Value
Absolute change
Change from the previous value
jan 1, 2009
49.991
+49.991
0.0%
jan 1, 2010
51.284
+1.293
2.59%
jan 1, 2011
52.106
+0.822
1.6%
jan 1, 2012
52.88
+0.774
1.48%
jan 1, 2013
53.363
+0.483
0.91%
jan 1, 2014
53.032
-0.331
-0.62%
jan 1, 2015
54.751
+1.72
3.24%
Ranking of countries by current statistics by years