Download This statistics in other country:
Timeline:
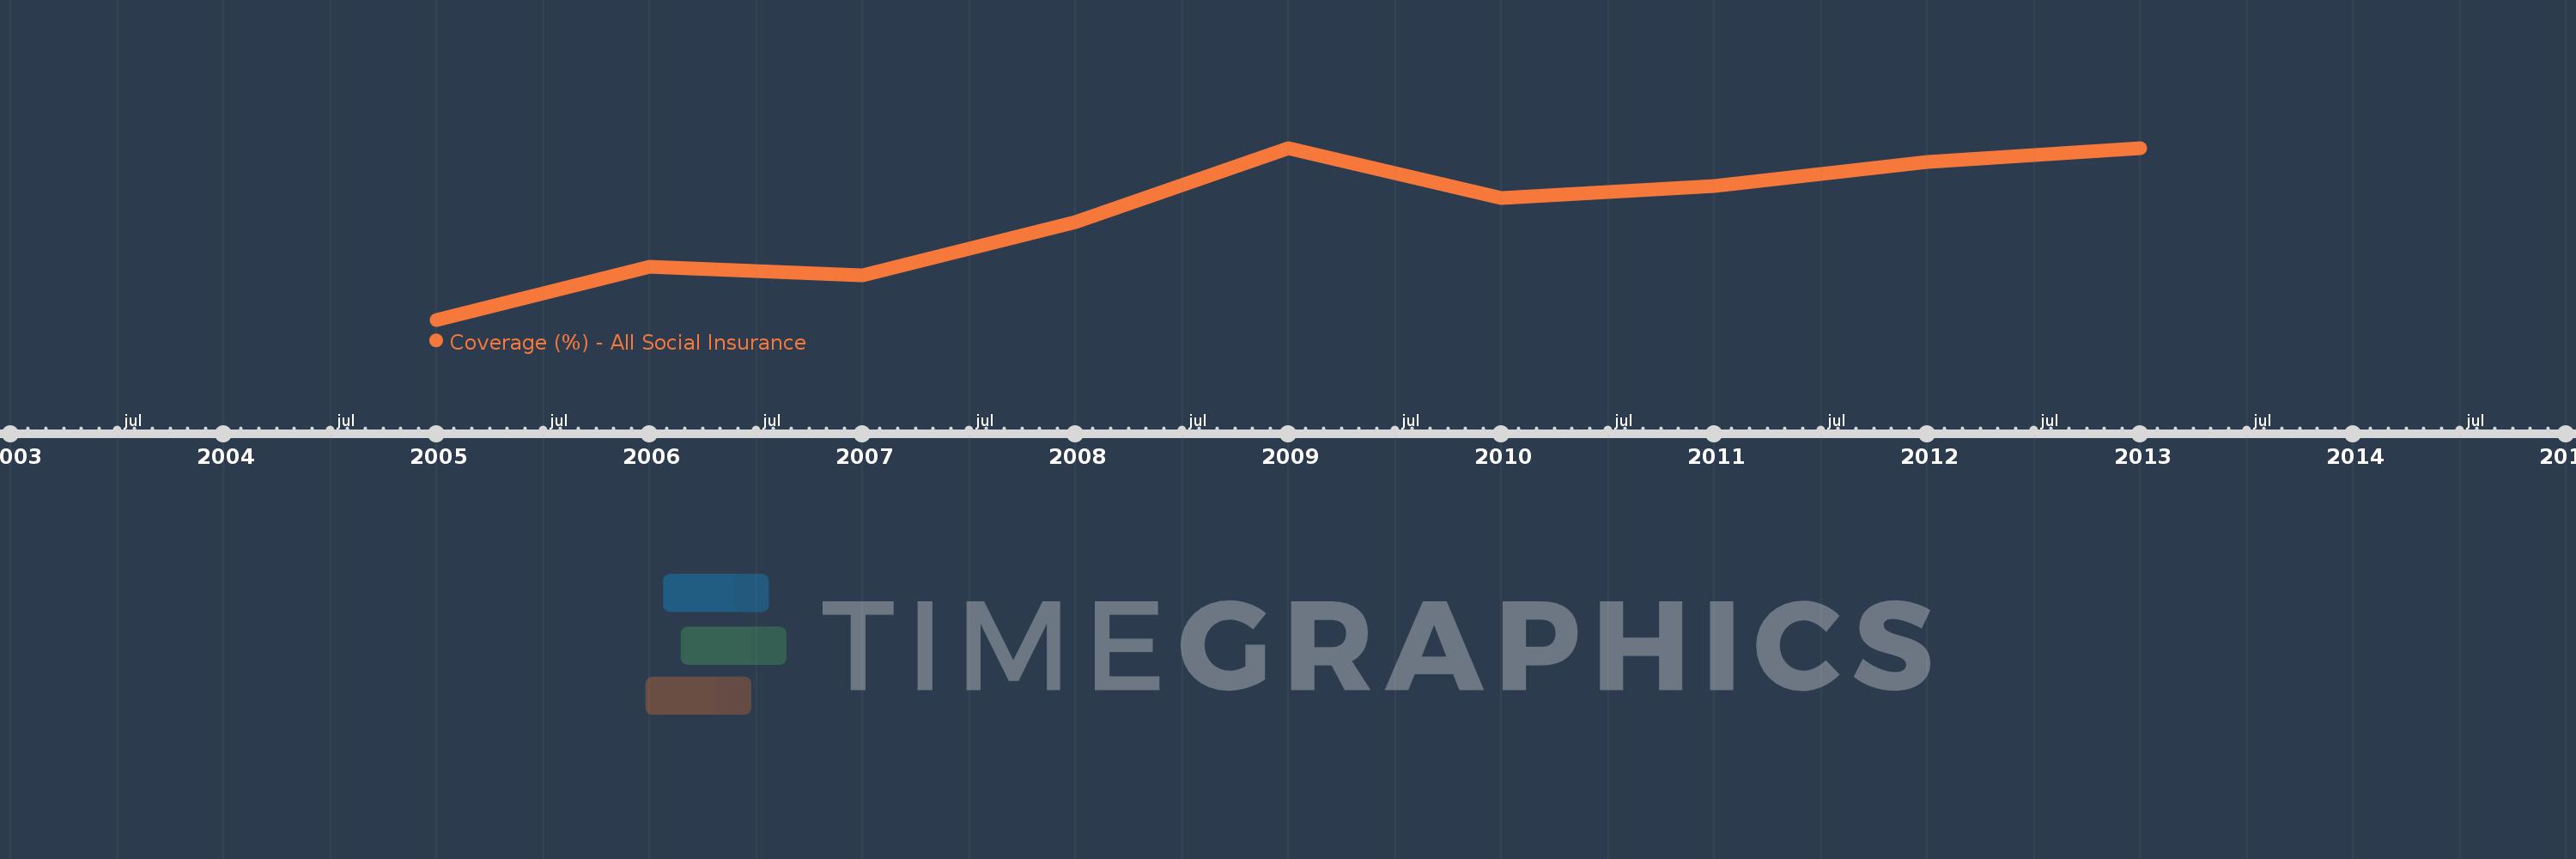
This timeline shows a graph from 2005 to 2013 of Turkey. No data until 2004. Number of actual observations by date: 9.
Source name:
World Development Indicators
Source organization:
The Atlas of Social Protection: Indicators of Resilience and Equity (ASPIRE)
Categories, topics:
Social Protection & Labor
Last updated:
apr 23, 2017
Indicators value changes by year
Maximum:
34.632
jan 1, 2013
At the date of observation
Value
Absolute change
Change from the previous value
jan 1, 2005
29.41
+29.41
0.0%
jan 1, 2006
31.017
+1.607
5.46%
jan 1, 2007
30.75
-0.267
-0.86%
jan 1, 2008
32.379
+1.629
5.3%
jan 1, 2009
34.624
+2.245
6.93%
jan 1, 2010
33.121
-1.503
-4.34%
jan 1, 2011
33.487
+0.366
1.11%
jan 1, 2012
34.195
+0.708
2.12%
jan 1, 2013
34.632
+0.436
1.28%
Ranking of countries by current statistics by years