Download This statistics in other country:
Timeline:
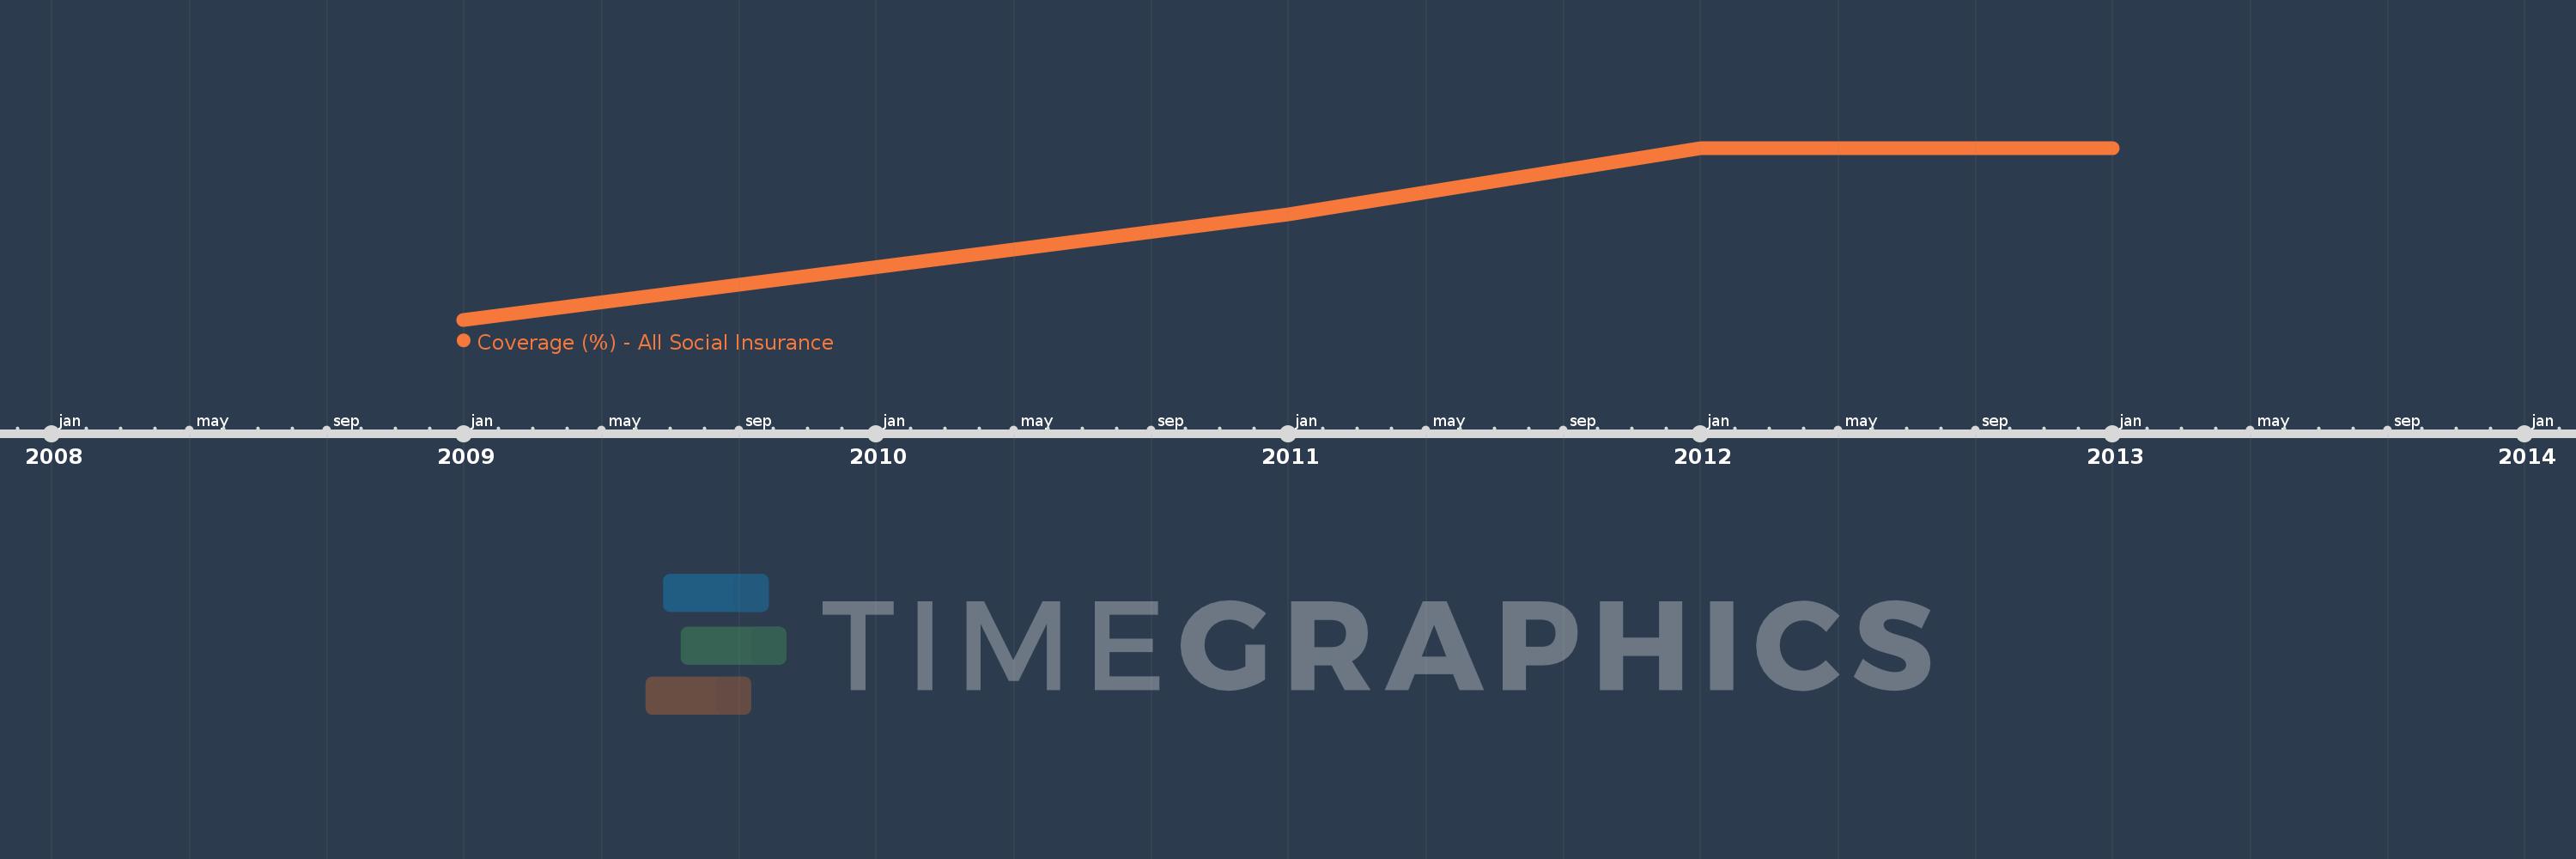
This timeline shows a graph from 2009 to 2013 of Ecuador. No data until 2008. Number of actual observations by date: 4.
Source name:
World Development Indicators
Source organization:
The Atlas of Social Protection: Indicators of Resilience and Equity (ASPIRE)
Categories, topics:
Social Protection & Labor
Last updated:
apr 23, 2017
Indicators value changes by year
Maximum:
10.675
jan 1, 2012
At the date of observation
Value
Absolute change
Change from the previous value
jan 1, 2009
7.255
+7.255
0.0%
jan 1, 2011
9.355
+2.1
28.94%
jan 1, 2012
10.675
+1.32
14.11%
jan 1, 2013
10.675
0.0
0.0%
Ranking of countries by current statistics by years