Download This statistics in other country:
Timeline:
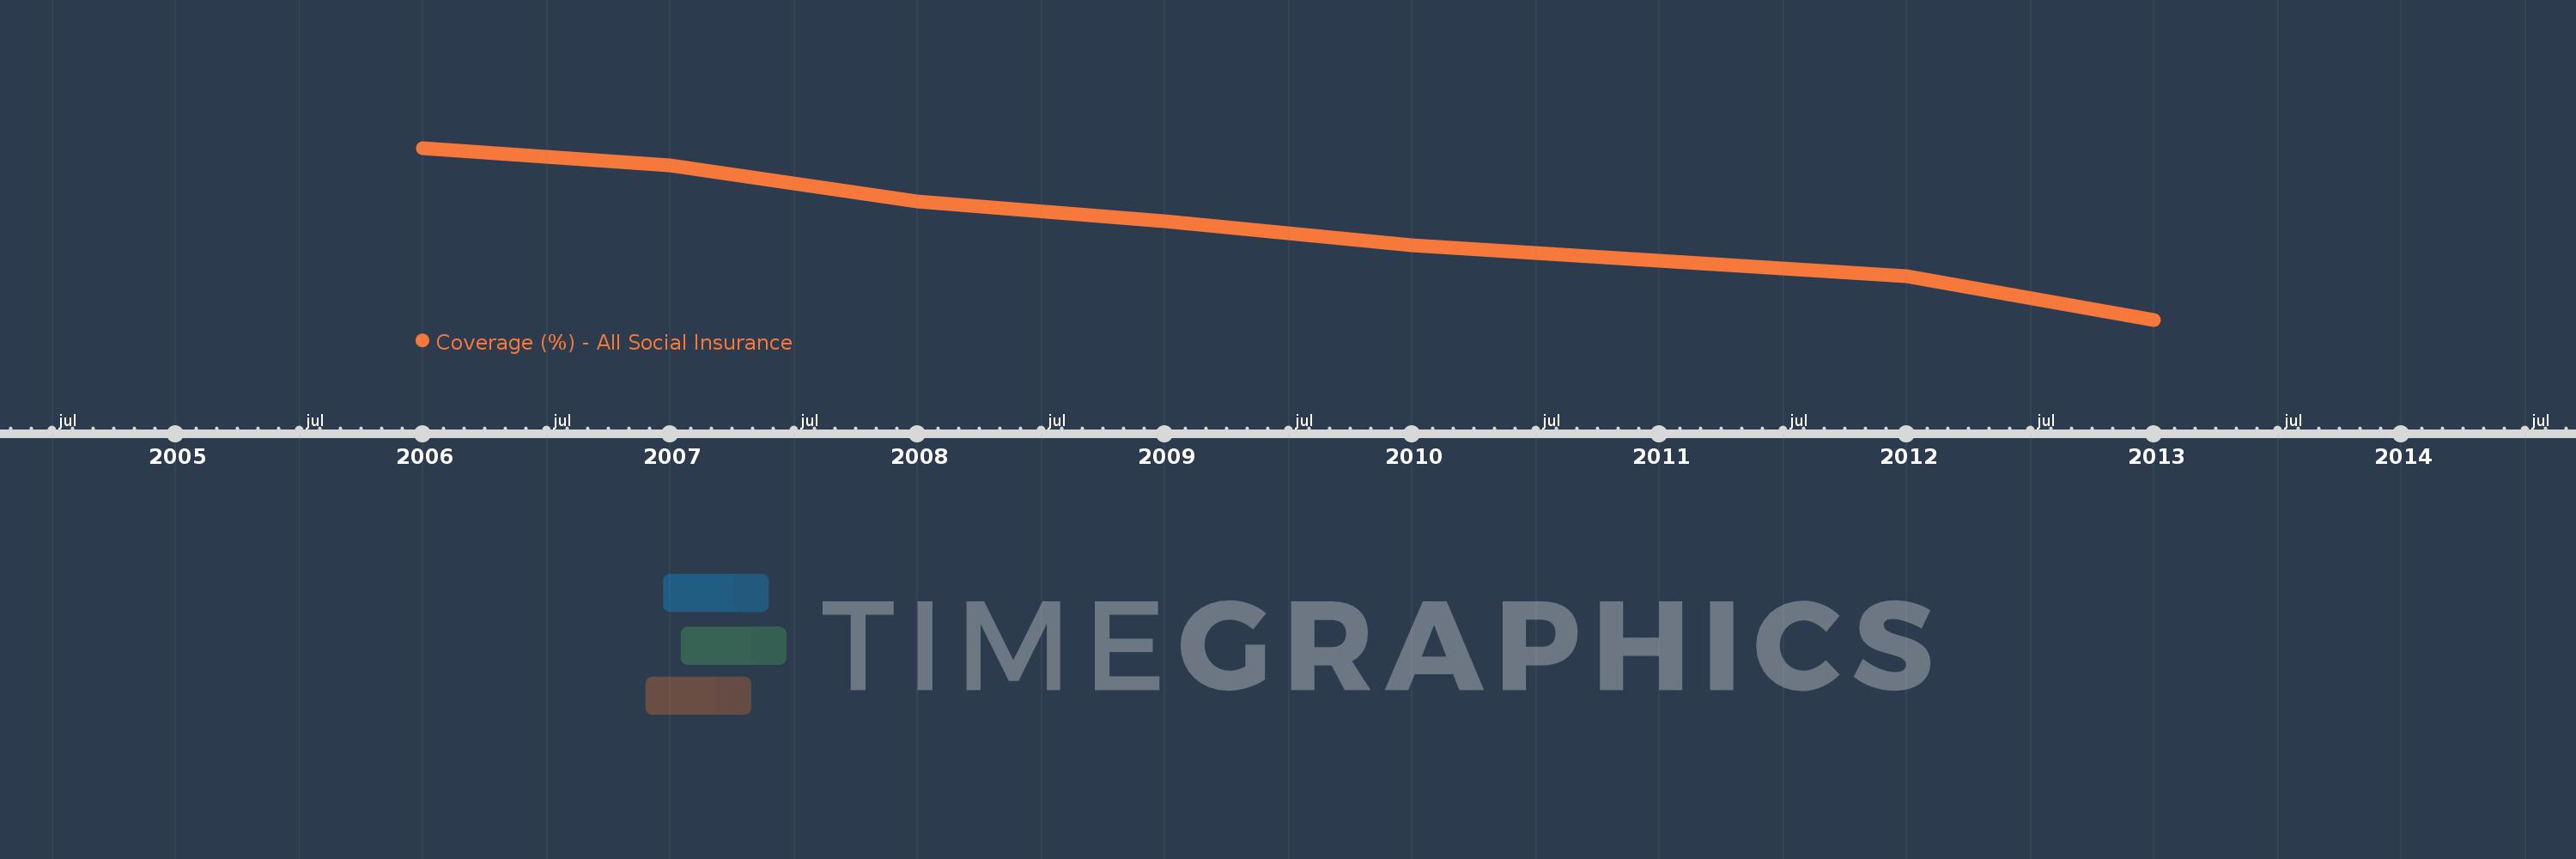
This timeline shows a graph from 2006 to 2013 of Poland. No data until 2005. Number of actual observations by date: 8.
Source name:
World Development Indicators
Source organization:
The Atlas of Social Protection: Indicators of Resilience and Equity (ASPIRE)
Categories, topics:
Social Protection & Labor
Last updated:
apr 23, 2017
Indicators value changes by year
Minimum:
43.788
jan 1, 2013
Maximum:
48.398
jan 1, 2006
At the date of observation
Value
Absolute change
Change from the previous value
jan 1, 2006
48.398
+48.398
0.0%
jan 1, 2007
47.928
-0.47
-0.97%
jan 1, 2008
46.971
-0.957
-2.0%
jan 1, 2009
46.439
-0.532
-1.13%
jan 1, 2010
45.792
-0.647
-1.39%
jan 1, 2011
45.368
-0.424
-0.93%
jan 1, 2012
44.953
-0.415
-0.91%
jan 1, 2013
43.788
-1.165
-2.59%
Ranking of countries by current statistics by years