Download This statistics in other country:
Timeline:
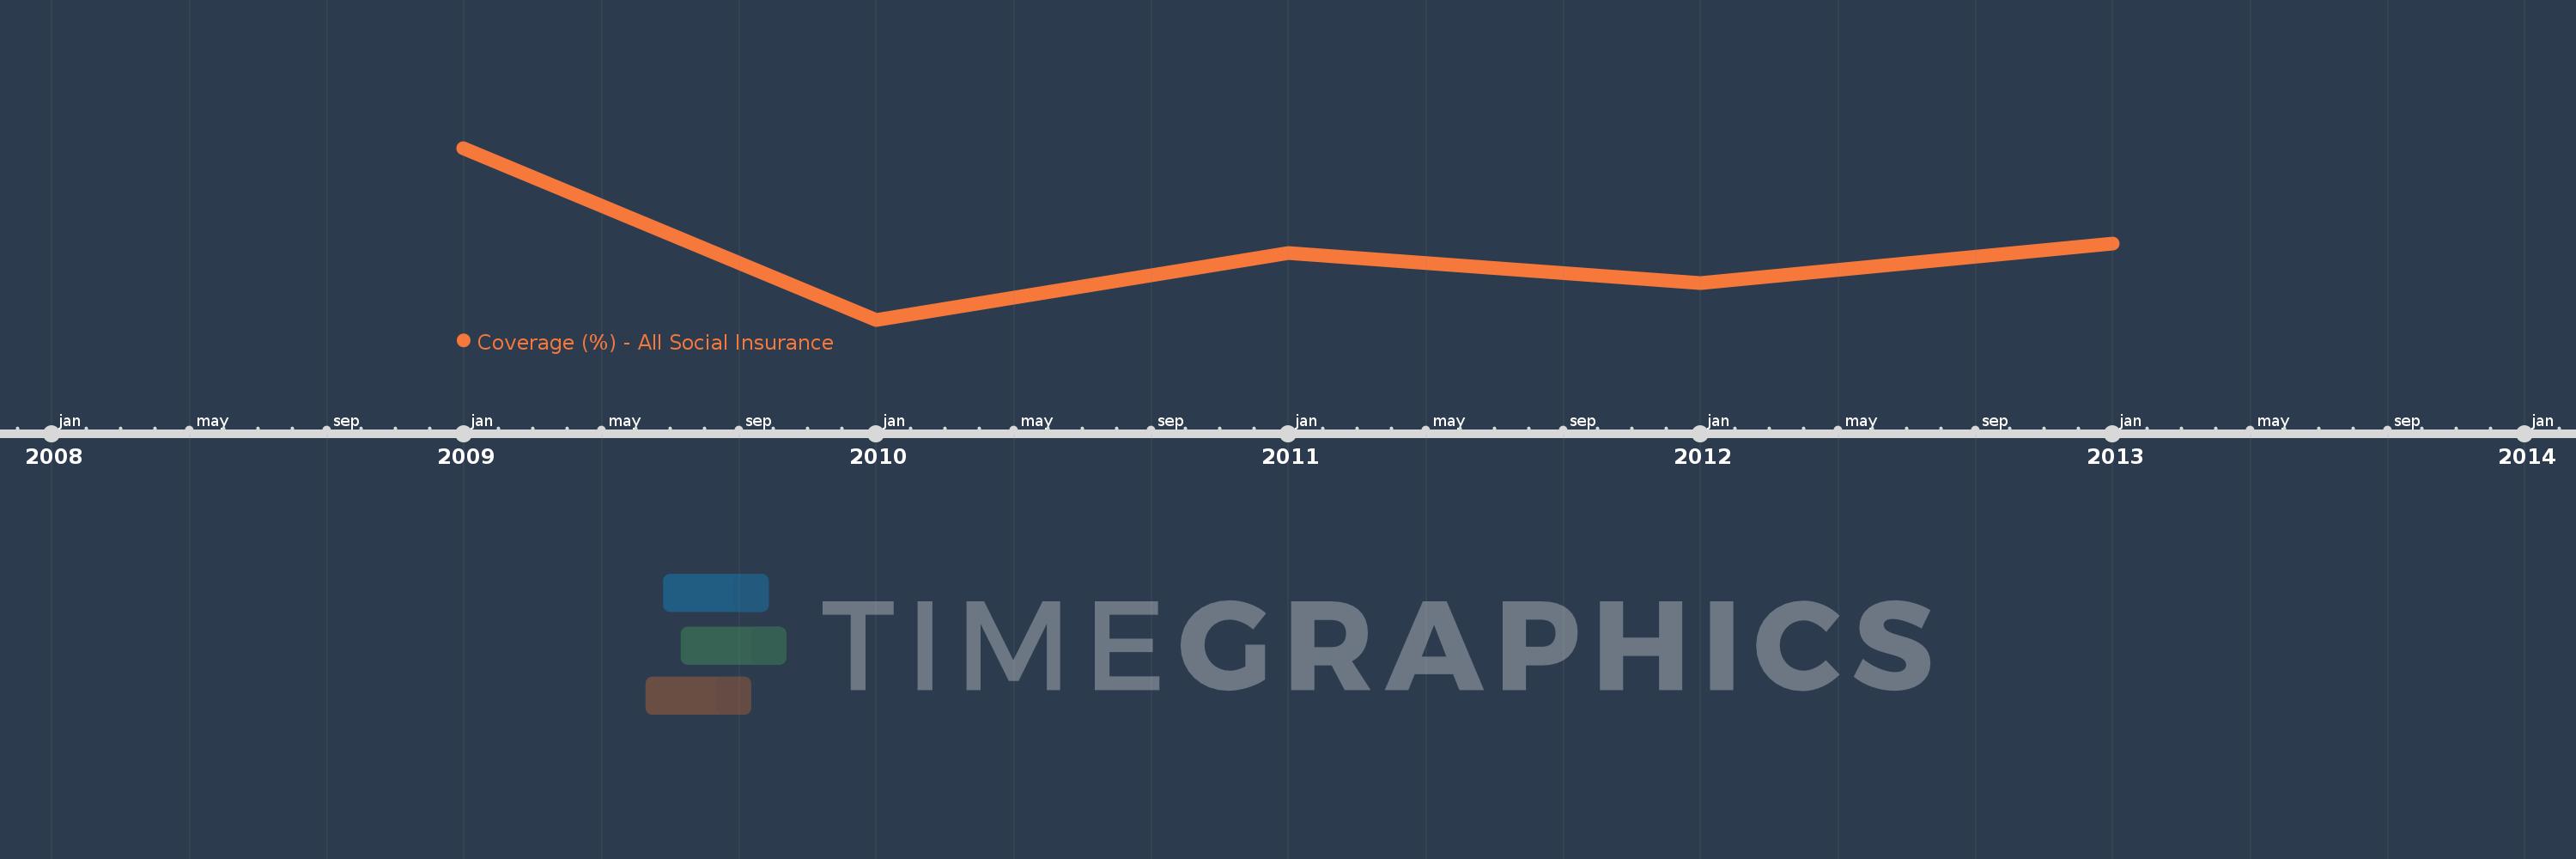
This timeline shows a graph from 2009 to 2013 of Uruguay. No data until 2008. Number of actual observations by date: 5.
Source name:
World Development Indicators
Source organization:
The Atlas of Social Protection: Indicators of Resilience and Equity (ASPIRE)
Categories, topics:
Social Protection & Labor
Last updated:
apr 23, 2017
Indicators value changes by year
Minimum:
35.864
jan 1, 2010
Maximum:
37.425
jan 1, 2009
At the date of observation
Value
Absolute change
Change from the previous value
jan 1, 2009
37.425
+37.425
0.0%
jan 1, 2010
35.864
-1.561
-4.17%
jan 1, 2011
36.469
+0.605
1.69%
jan 1, 2012
36.194
-0.274
-0.75%
jan 1, 2013
36.557
+0.363
1.0%
Ranking of countries by current statistics by years