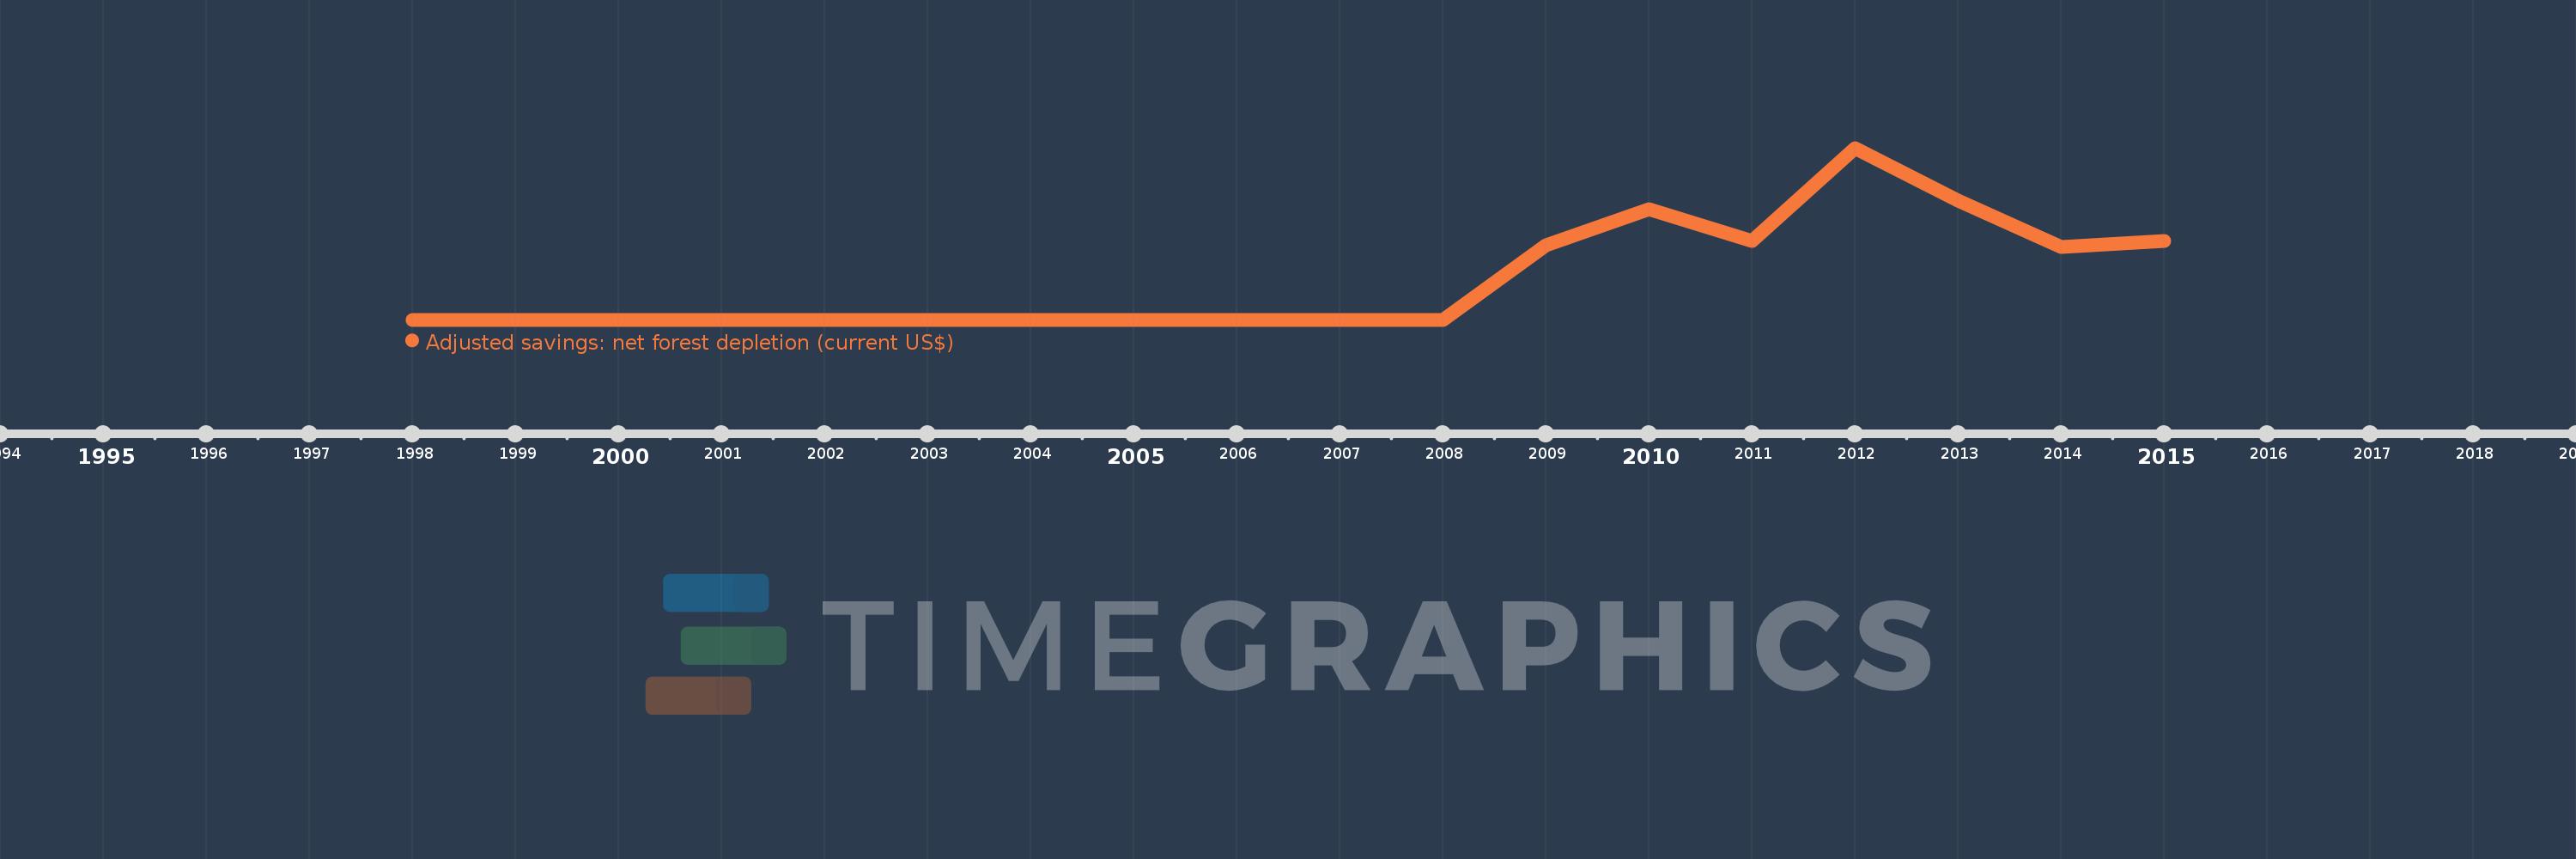
This timeline shows a graph from 1998 to 2015 of Armenia. No data until 1997. Number of actual observations by date: 16.
Source name:
World Development Indicators
Source organization:
World Bank staff estimates based on sources and methods in World Bank's "The Changing Wealth of Nations: Measuring Sustainable Development in the New Millennium" (2011).
Categories, topics:
Economy & Growth, Environment
Last updated:
apr 23, 2017
Indicators value changes by year
Meaning:
12.428 mln
Minimum:
0.0
jan 1, 1998
Maximum:
48.308 mln
jan 1, 2012
At the date of observation
Value
Absolute change
Change from the previous value
jan 1, 1998
0.0
0.0
0.0%
jan 1, 2001
0.0
0.0
%
jan 1, 2002
0.0
0.0
%
jan 1, 2003
0.0
0.0
%
jan 1, 2004
0.0
0.0
%
jan 1, 2005
0.0
0.0
%
jan 1, 2006
0.0
0.0
%
jan 1, 2007
0.0
0.0
%
jan 1, 2008
0.0
0.0
%
jan 1, 2009
21.002 mln
+21.002 mln
%
jan 1, 2010
31.118 mln
+10.116 mln
48.17%
jan 1, 2011
22.182 mln
-8.936 mln
-28.72%
jan 1, 2012
48.308 mln
+26.125 mln
117.78%
jan 1, 2013
33.605 mln
-14.703 mln
-30.44%
jan 1, 2014
20.412 mln
-13.193 mln
-39.26%
jan 1, 2015
22.223 mln
+1.811 mln
8.87%
Ranking of countries by current statistics by years