33
/
AIzaSyAYiBZKx7MnpbEhh9jyipgxe19OcubqV5w
August 1, 2025
242292
Slovenia
SVN
true
2
1
Adjusted savings: net forest depletion (current US$)
2015,2014,2013,2012,2011,2010,2009,2008,2007,2006,2005,2004,2003,2002,2001,2000,1999,1998,1997,1996,1995,1994,1993
Download
Global statistics library →Slovenia →

Adjusted savings: net forest depletion (current US$)

This statistics in other country:

AfghanistanAlbaniaAlgeriaAngolaArgentinaArmeniaAustraliaAustriaAzerbaijanBahamas, TheBahrainBangladeshBarbadosBelarusBelgiumBelizeBeninBhutanBoliviaBotswanaBrazilBrunei DarussalamBulgariaBurkina FasoBurundiCabo VerdeCambodiaCameroonCanadaCentral African RepublicChadChileChinaColombiaComorosCongo, Dem. Rep.Congo, Rep.Costa RicaCote d'IvoireCroatiaCubaCyprusCzech RepublicDenmarkDjiboutiDominicaDominican RepublicEcuadorEgypt, Arab Rep.El SalvadorEquatorial GuineaEritreaEstoniaEthiopiaFijiFinlandFranceFrench PolynesiaGabonGambia, TheGeorgiaGermanyGhanaGreeceGuatemalaGuineaGuinea-BissauGuyanaHaitiHondurasHong Kong SAR, ChinaHungaryIcelandIndiaIndonesiaIran, Islamic Rep.IraqIrelandIsraelItalyJamaicaJapanJordanKazakhstanKenyaKiribatiKorea, Dem. People’s Rep.Korea, Rep.KuwaitKyrgyz RepublicLao PDRLatviaLebanonLesothoLiberiaLibyaLithuaniaLuxembourgMacao SAR, ChinaMacedonia, FYRMadagascarMalawiMalaysiaMaldivesMaliMauritaniaMauritiusMexicoMicronesia, Fed. Sts.MoldovaMongoliaMoroccoMozambiqueMyanmarNamibiaNepalNetherlandsNew CaledoniaNew ZealandNicaraguaNigerNigeriaNorwayOmanPakistanPanamaPapua New GuineaParaguayPeruPhilippinesPolandPortugalQatarRomaniaRussian FederationRwandaSamoaSao Tome and PrincipeSaudi ArabiaSenegalSeychellesSierra LeoneSingaporeSlovak RepublicSloveniaSolomon IslandsSomaliaSouth AfricaSpainSri LankaSt. LuciaSt. Vincent and the GrenadinesSudanSurinameSwazilandSwedenSwitzerlandSyrian Arab RepublicTajikistanTanzaniaThailandTogoTongaTrinidad and TobagoTunisiaTurkeyTurkmenistanUgandaUkraineUnited Arab EmiratesUnited KingdomUnited StatesUruguayUzbekistanVanuatuVenezuela, RBVietnamYemen, Rep.ZambiaZimbabwe

Timeline:

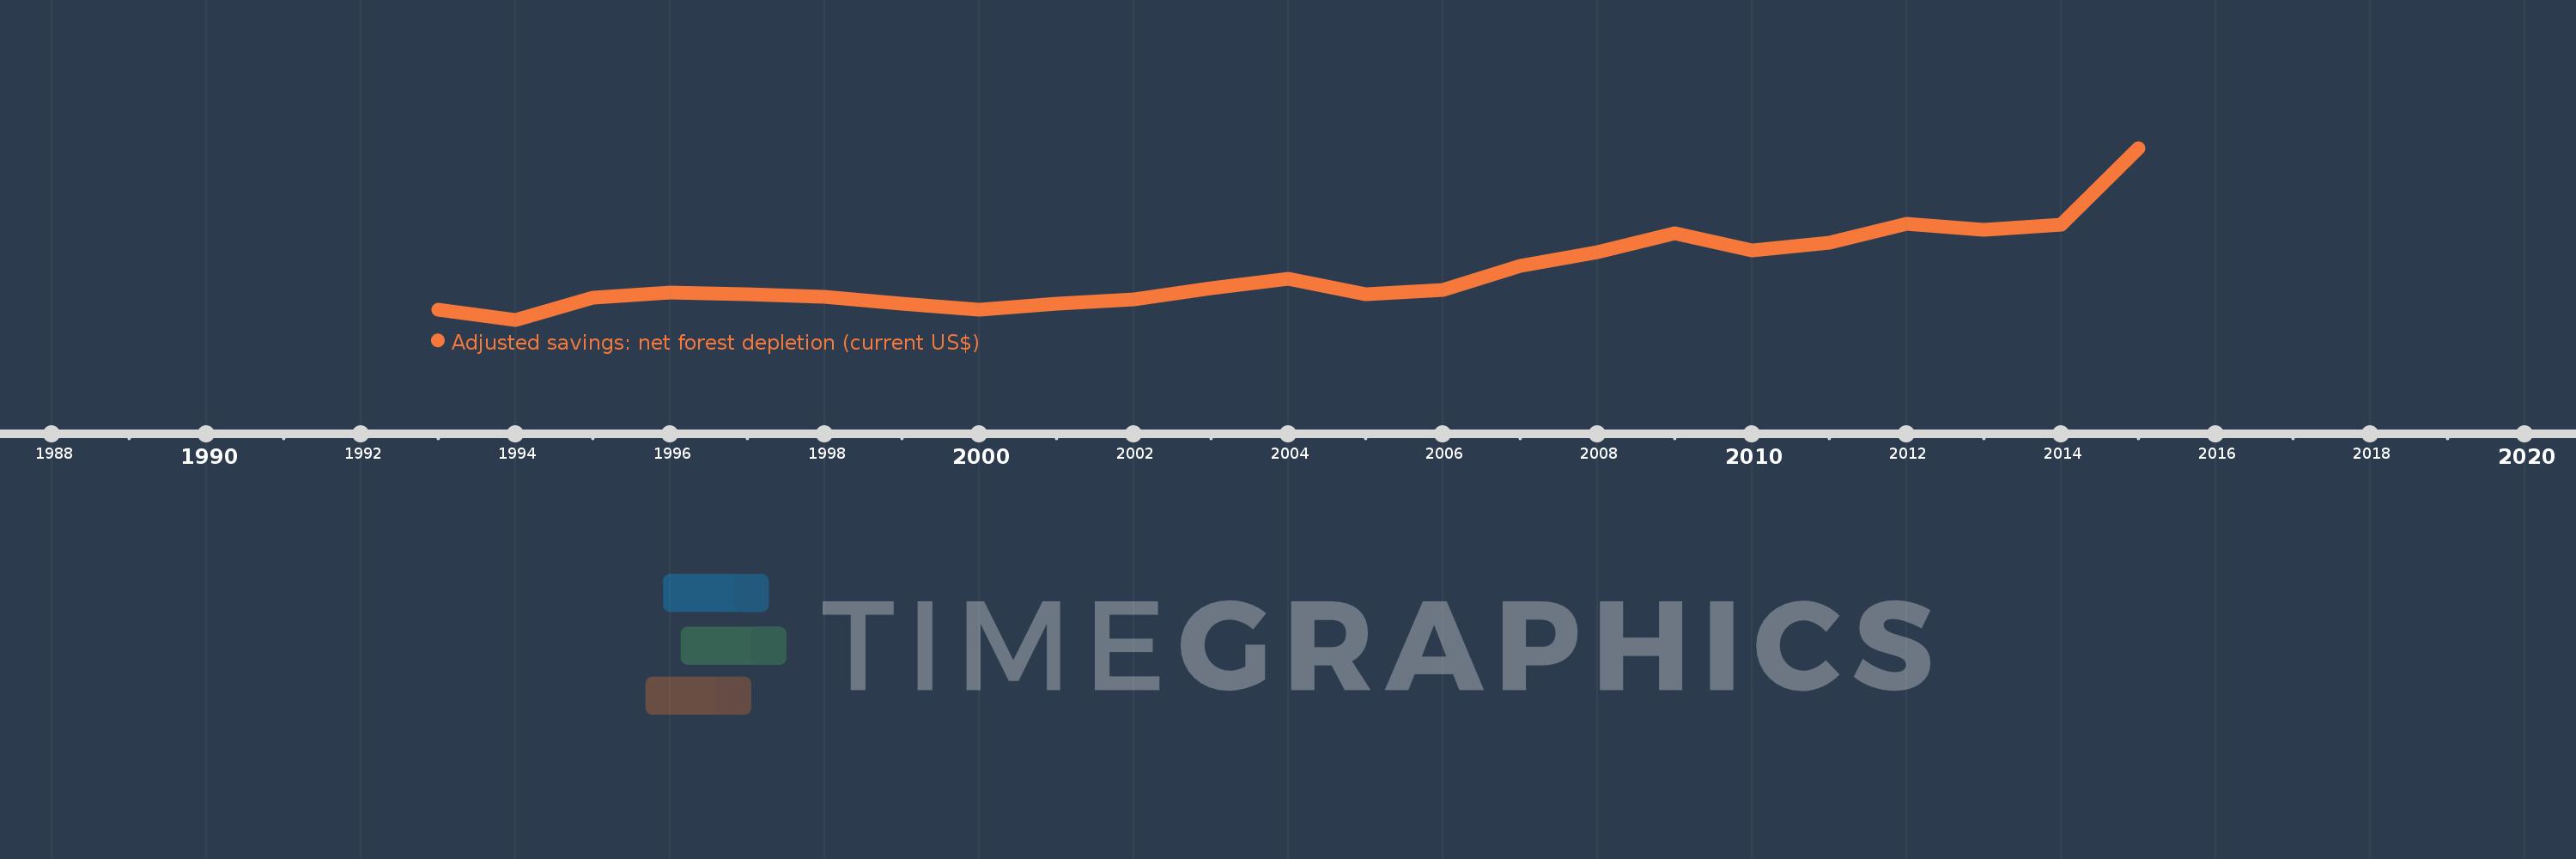
This timeline shows a graph from 1993 to 2015 of Slovenia. No data until 1992. Number of actual observations by date: 23.

Source name:

World Development Indicators

Source organization:

World Bank staff estimates based on sources and methods in World Bank's "The Changing Wealth of Nations: Measuring Sustainable Development in the New Millennium" (2011).

Categories, topics:

Economy & Growth, Environment

Last updated:

apr 23, 2017

Indicators value changes by year

Meaning:
96.908 mln
Minimum:
38.164 mln
jan 1, 1994
Maximum:
248.56 mln
jan 1, 2015
At the date of observation
Value
Absolute change
Change from the previous value
jan 1, 1993
50.102 mln
+50.102 mln
0.0%
jan 1, 1994
38.164 mln
-11.938 mln
-23.83%
jan 1, 1995
65.451 mln
+27.287 mln
71.5%
jan 1, 1996
71.636 mln
+6.185 mln
9.45%
jan 1, 1997
68.984 mln
-2.652 mln
-3.7%
jan 1, 1998
65.943 mln
-3.041 mln
-4.41%
jan 1, 1999
58.295 mln
-7.648 mln
-11.6%
jan 1, 2000
50.576 mln
-7.719 mln
-13.24%
jan 1, 2001
57.62 mln
+7.043 mln
13.93%
jan 1, 2002
63.164 mln
+5.544 mln
9.62%
jan 1, 2003
76.72 mln
+13.556 mln
21.46%
jan 1, 2004
88.056 mln
+11.336 mln
14.78%
jan 1, 2005
69.038 mln
-19.018 mln
-21.6%
jan 1, 2006
74.567 mln
+5.529 mln
8.01%
jan 1, 2007
104.021 mln
+29.454 mln
39.5%
jan 1, 2008
120.536 mln
+16.514 mln
15.88%
jan 1, 2009
143.597 mln
+23.061 mln
19.13%
jan 1, 2010
123.433 mln
-20.164 mln
-14.04%
jan 1, 2011
132.282 mln
+8.848 mln
7.17%
jan 1, 2012
155.287 mln
+23.005 mln
17.39%
jan 1, 2013
147.857 mln
-7.43 mln
-4.78%
jan 1, 2014
154.989 mln
+7.132 mln
4.82%
jan 1, 2015
248.56 mln
+93.571 mln
60.37%

Ranking of countries by current statistics by years