33
/
AIzaSyAYiBZKx7MnpbEhh9jyipgxe19OcubqV5w
August 1, 2025
117596
Czech Republic
CZE
true
2
1
Adjusted savings: net forest depletion (current US$)
2015,2014,2013,2012,2011,2010,2009,2008,2007,2006,2005,2004,2003,2002,2001,2000,1999,1998,1997,1996,1995,1994
Download
Global statistics library →Czech Republic →

Adjusted savings: net forest depletion (current US$)

This statistics in other country:

AfghanistanAlbaniaAlgeriaAngolaArgentinaArmeniaAustraliaAustriaAzerbaijanBahamas, TheBahrainBangladeshBarbadosBelarusBelgiumBelizeBeninBhutanBoliviaBotswanaBrazilBrunei DarussalamBulgariaBurkina FasoBurundiCabo VerdeCambodiaCameroonCanadaCentral African RepublicChadChileChinaColombiaComorosCongo, Dem. Rep.Congo, Rep.Costa RicaCote d'IvoireCroatiaCubaCyprusCzech RepublicDenmarkDjiboutiDominicaDominican RepublicEcuadorEgypt, Arab Rep.El SalvadorEquatorial GuineaEritreaEstoniaEthiopiaFijiFinlandFranceFrench PolynesiaGabonGambia, TheGeorgiaGermanyGhanaGreeceGuatemalaGuineaGuinea-BissauGuyanaHaitiHondurasHong Kong SAR, ChinaHungaryIcelandIndiaIndonesiaIran, Islamic Rep.IraqIrelandIsraelItalyJamaicaJapanJordanKazakhstanKenyaKiribatiKorea, Dem. People’s Rep.Korea, Rep.KuwaitKyrgyz RepublicLao PDRLatviaLebanonLesothoLiberiaLibyaLithuaniaLuxembourgMacao SAR, ChinaMacedonia, FYRMadagascarMalawiMalaysiaMaldivesMaliMauritaniaMauritiusMexicoMicronesia, Fed. Sts.MoldovaMongoliaMoroccoMozambiqueMyanmarNamibiaNepalNetherlandsNew CaledoniaNew ZealandNicaraguaNigerNigeriaNorwayOmanPakistanPanamaPapua New GuineaParaguayPeruPhilippinesPolandPortugalQatarRomaniaRussian FederationRwandaSamoaSao Tome and PrincipeSaudi ArabiaSenegalSeychellesSierra LeoneSingaporeSlovak RepublicSloveniaSolomon IslandsSomaliaSouth AfricaSpainSri LankaSt. LuciaSt. Vincent and the GrenadinesSudanSurinameSwazilandSwedenSwitzerlandSyrian Arab RepublicTajikistanTanzaniaThailandTogoTongaTrinidad and TobagoTunisiaTurkeyTurkmenistanUgandaUkraineUnited Arab EmiratesUnited KingdomUnited StatesUruguayUzbekistanVanuatuVenezuela, RBVietnamYemen, Rep.ZambiaZimbabwe

Timeline:

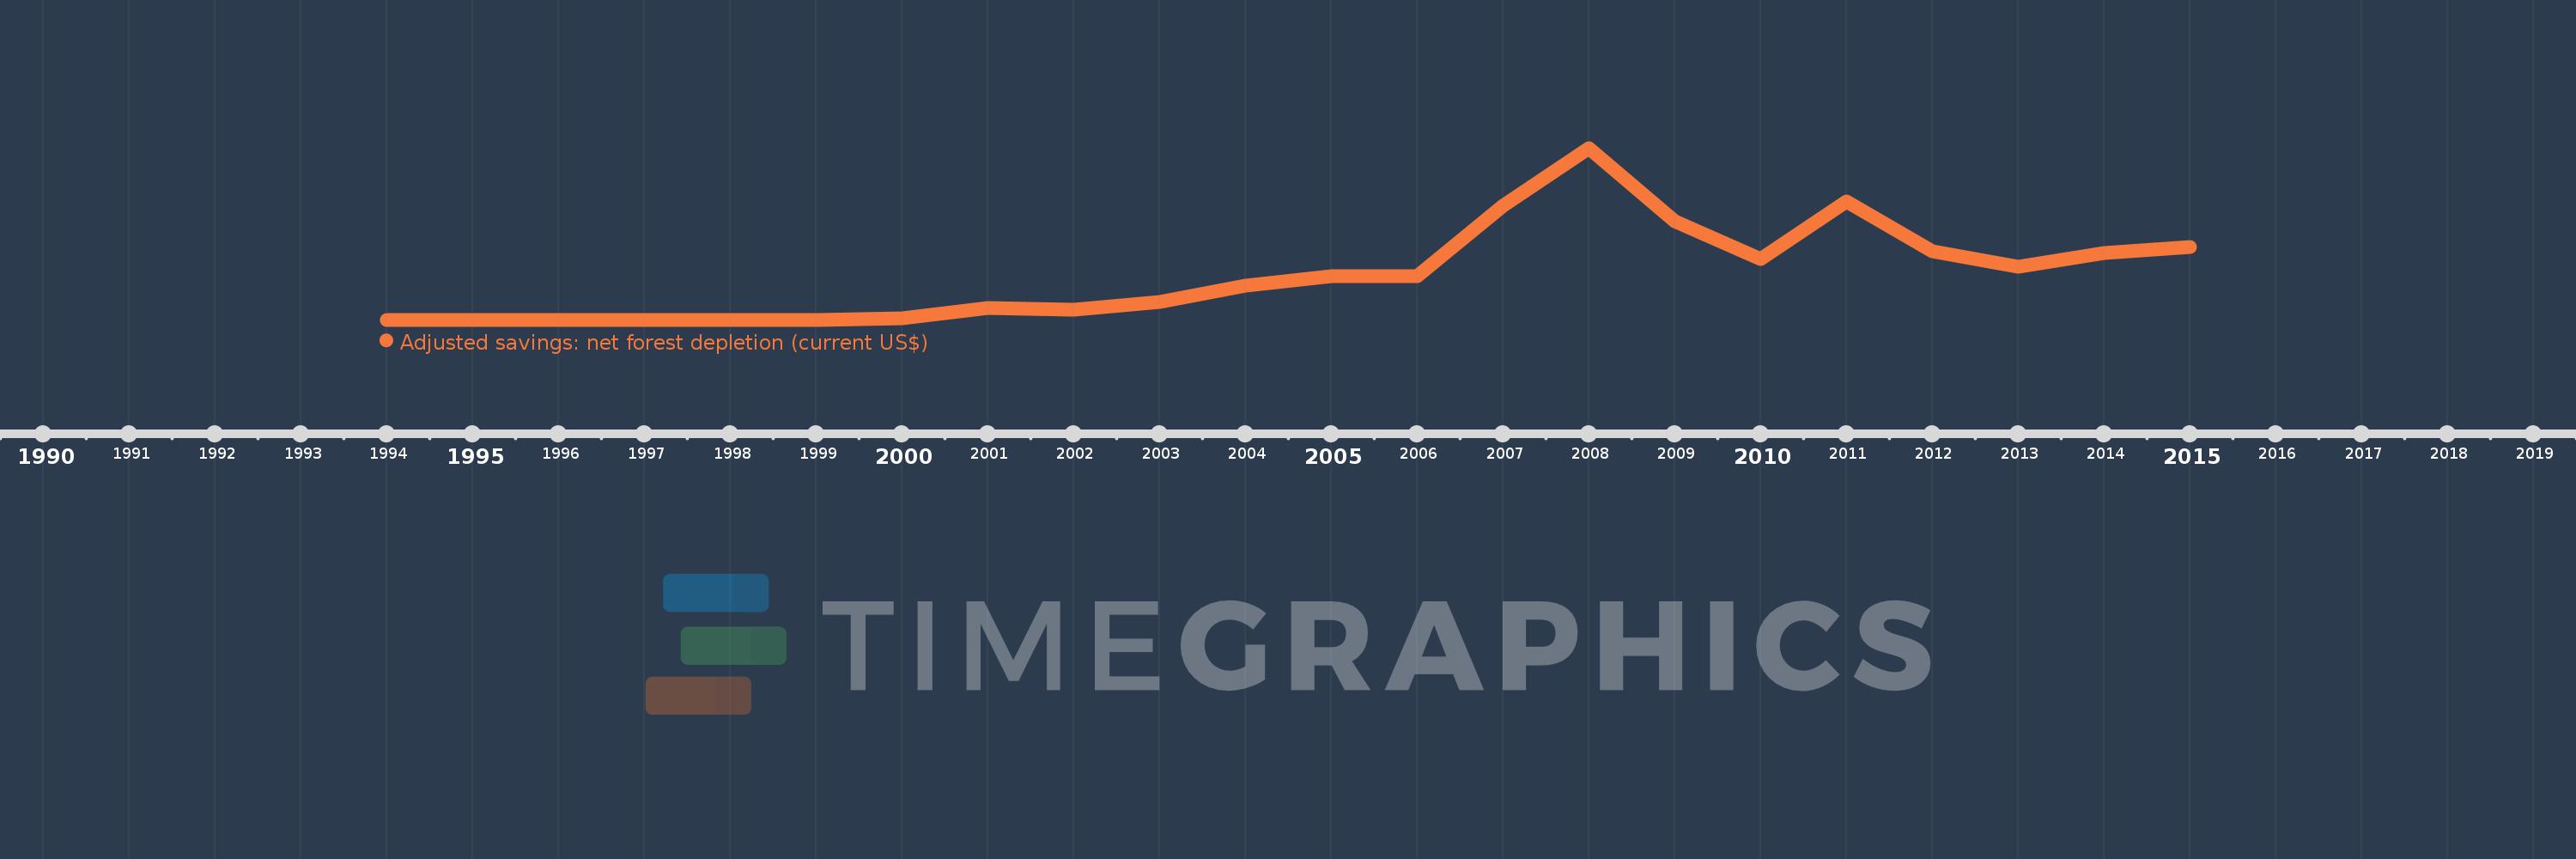
This timeline shows a graph from 1994 to 2015 of Czech Republic. No data until 1993. Number of actual observations by date: 22.

Source name:

World Development Indicators

Source organization:

World Bank staff estimates based on sources and methods in World Bank's "The Changing Wealth of Nations: Measuring Sustainable Development in the New Millennium" (2011).

Categories, topics:

Economy & Growth, Environment

Last updated:

apr 23, 2017

Indicators value changes by year

Meaning:
45.655 mln
Minimum:
0.0
jan 1, 1994
Maximum:
174.777 mln
jan 1, 2008
At the date of observation
Value
Absolute change
Change from the previous value
jan 1, 1994
0.0
0.0
0.0%
jan 1, 1995
0.0
0.0
%
jan 1, 1996
0.0
0.0
%
jan 1, 1997
0.0
0.0
%
jan 1, 1998
0.0
0.0
%
jan 1, 1999
0.0
0.0
%
jan 1, 2000
1.501 mln
+1.501 mln
%
jan 1, 2001
11.612 mln
+10.111 mln
673.66%
jan 1, 2002
9.813 mln
-1.799 mln
-15.49%
jan 1, 2003
18.377 mln
+8.565 mln
87.28%
jan 1, 2004
34.723 mln
+16.346 mln
88.94%
jan 1, 2005
44.32 mln
+9.597 mln
27.64%
jan 1, 2006
44.594 mln
+274.105K
0.62%
jan 1, 2007
115.575 mln
+70.981 mln
159.17%
jan 1, 2008
174.777 mln
+59.202 mln
51.22%
jan 1, 2009
100.422 mln
-74.355 mln
-42.54%
jan 1, 2010
62.064 mln
-38.358 mln
-38.2%
jan 1, 2011
120.729 mln
+58.666 mln
94.52%
jan 1, 2012
70.07 mln
-50.659 mln
-41.96%
jan 1, 2013
53.711 mln
-16.359 mln
-23.35%
jan 1, 2014
67.679 mln
+13.968 mln
26.0%
jan 1, 2015
74.432 mln
+6.753 mln
9.98%

Ranking of countries by current statistics by years