33
/
AIzaSyAYiBZKx7MnpbEhh9jyipgxe19OcubqV5w
August 1, 2025
129040
Estonia
EST
true
2
1
Adjusted savings: net forest depletion (current US$)
2015,2014,2013,2012,2011,2010,2009,2008,2007,2006,2005,2004,2003,2002,2001,2000,1999,1998,1997,1996,1995,1994,1993
Download
Global statistics library →Estonia →

Adjusted savings: net forest depletion (current US$)

This statistics in other country:

AfghanistanAlbaniaAlgeriaAngolaArgentinaArmeniaAustraliaAustriaAzerbaijanBahamas, TheBahrainBangladeshBarbadosBelarusBelgiumBelizeBeninBhutanBoliviaBotswanaBrazilBrunei DarussalamBulgariaBurkina FasoBurundiCabo VerdeCambodiaCameroonCanadaCentral African RepublicChadChileChinaColombiaComorosCongo, Dem. Rep.Congo, Rep.Costa RicaCote d'IvoireCroatiaCubaCyprusCzech RepublicDenmarkDjiboutiDominicaDominican RepublicEcuadorEgypt, Arab Rep.El SalvadorEquatorial GuineaEritreaEstoniaEthiopiaFijiFinlandFranceFrench PolynesiaGabonGambia, TheGeorgiaGermanyGhanaGreeceGuatemalaGuineaGuinea-BissauGuyanaHaitiHondurasHong Kong SAR, ChinaHungaryIcelandIndiaIndonesiaIran, Islamic Rep.IraqIrelandIsraelItalyJamaicaJapanJordanKazakhstanKenyaKiribatiKorea, Dem. People’s Rep.Korea, Rep.KuwaitKyrgyz RepublicLao PDRLatviaLebanonLesothoLiberiaLibyaLithuaniaLuxembourgMacao SAR, ChinaMacedonia, FYRMadagascarMalawiMalaysiaMaldivesMaliMauritaniaMauritiusMexicoMicronesia, Fed. Sts.MoldovaMongoliaMoroccoMozambiqueMyanmarNamibiaNepalNetherlandsNew CaledoniaNew ZealandNicaraguaNigerNigeriaNorwayOmanPakistanPanamaPapua New GuineaParaguayPeruPhilippinesPolandPortugalQatarRomaniaRussian FederationRwandaSamoaSao Tome and PrincipeSaudi ArabiaSenegalSeychellesSierra LeoneSingaporeSlovak RepublicSloveniaSolomon IslandsSomaliaSouth AfricaSpainSri LankaSt. LuciaSt. Vincent and the GrenadinesSudanSurinameSwazilandSwedenSwitzerlandSyrian Arab RepublicTajikistanTanzaniaThailandTogoTongaTrinidad and TobagoTunisiaTurkeyTurkmenistanUgandaUkraineUnited Arab EmiratesUnited KingdomUnited StatesUruguayUzbekistanVanuatuVenezuela, RBVietnamYemen, Rep.ZambiaZimbabwe

Timeline:

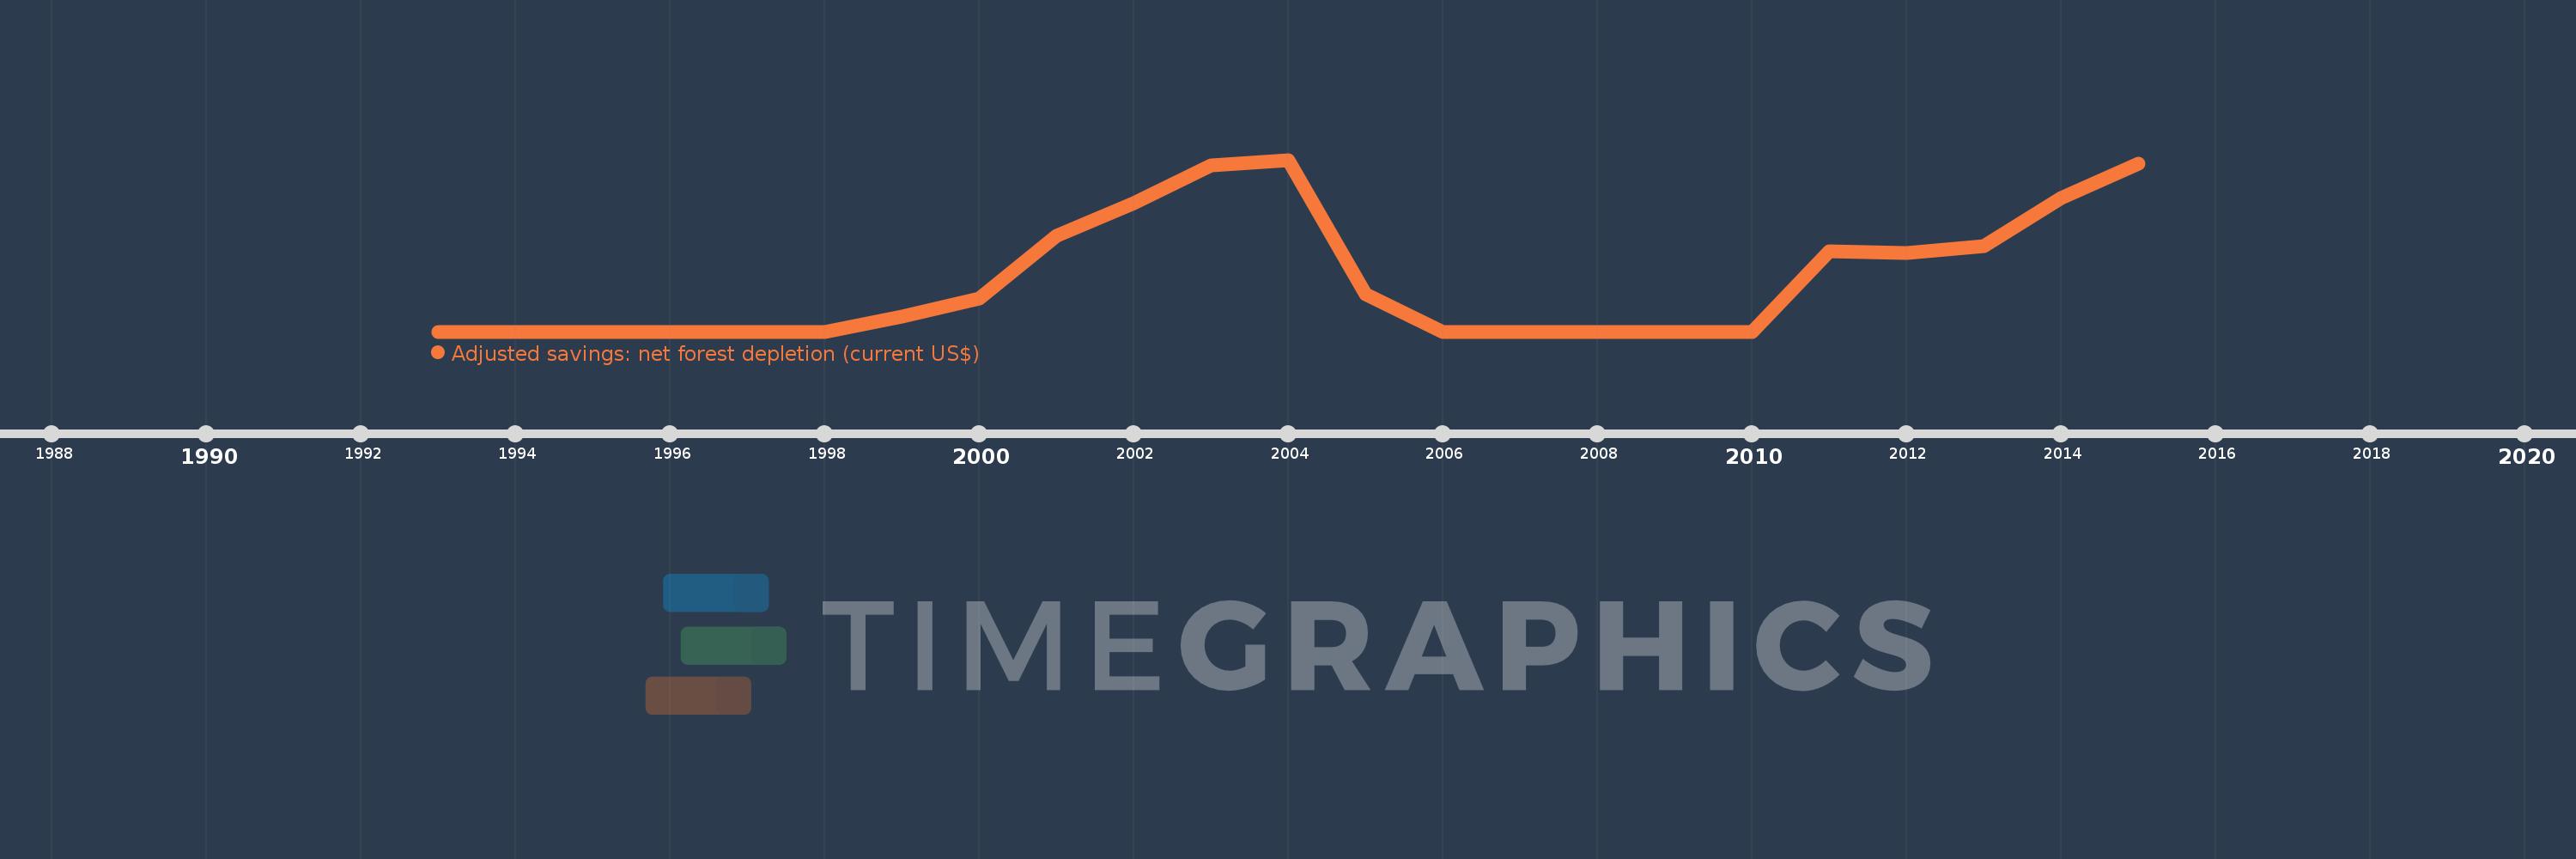
This timeline shows a graph from 1993 to 2015 of Estonia. No data until 1992. Number of actual observations by date: 23.

Source name:

World Development Indicators

Source organization:

World Bank staff estimates based on sources and methods in World Bank's "The Changing Wealth of Nations: Measuring Sustainable Development in the New Millennium" (2011).

Categories, topics:

Economy & Growth, Environment

Last updated:

apr 23, 2017

Indicators value changes by year

Meaning:
48.983 mln
Minimum:
0.0
jan 1, 1993
Maximum:
162.127 mln
jan 1, 2004
At the date of observation
Value
Absolute change
Change from the previous value
jan 1, 1993
0.0
0.0
0.0%
jan 1, 1994
0.0
0.0
%
jan 1, 1995
0.0
0.0
%
jan 1, 1996
0.0
0.0
%
jan 1, 1997
0.0
0.0
%
jan 1, 1998
0.0
0.0
%
jan 1, 1999
14.286 mln
+14.286 mln
%
jan 1, 2000
31.41 mln
+17.124 mln
119.87%
jan 1, 2001
90.189 mln
+58.778 mln
187.13%
jan 1, 2002
120.85 mln
+30.662 mln
34.0%
jan 1, 2003
156.8 mln
+35.949 mln
29.75%
jan 1, 2004
162.127 mln
+5.327 mln
3.4%
jan 1, 2005
35.488 mln
-126.639 mln
-78.11%
jan 1, 2006
0.0
-35.488 mln
-100.0%
jan 1, 2007
0.0
0.0
%
jan 1, 2008
0.0
0.0
%
jan 1, 2009
0.0
0.0
%
jan 1, 2010
0.0
0.0
%
jan 1, 2011
75.985 mln
+75.985 mln
%
jan 1, 2012
74.344 mln
-1.641 mln
-2.16%
jan 1, 2013
80.417 mln
+6.073 mln
8.17%
jan 1, 2014
126.062 mln
+45.645 mln
56.76%
jan 1, 2015
158.655 mln
+32.592 mln
25.85%

Ranking of countries by current statistics by years