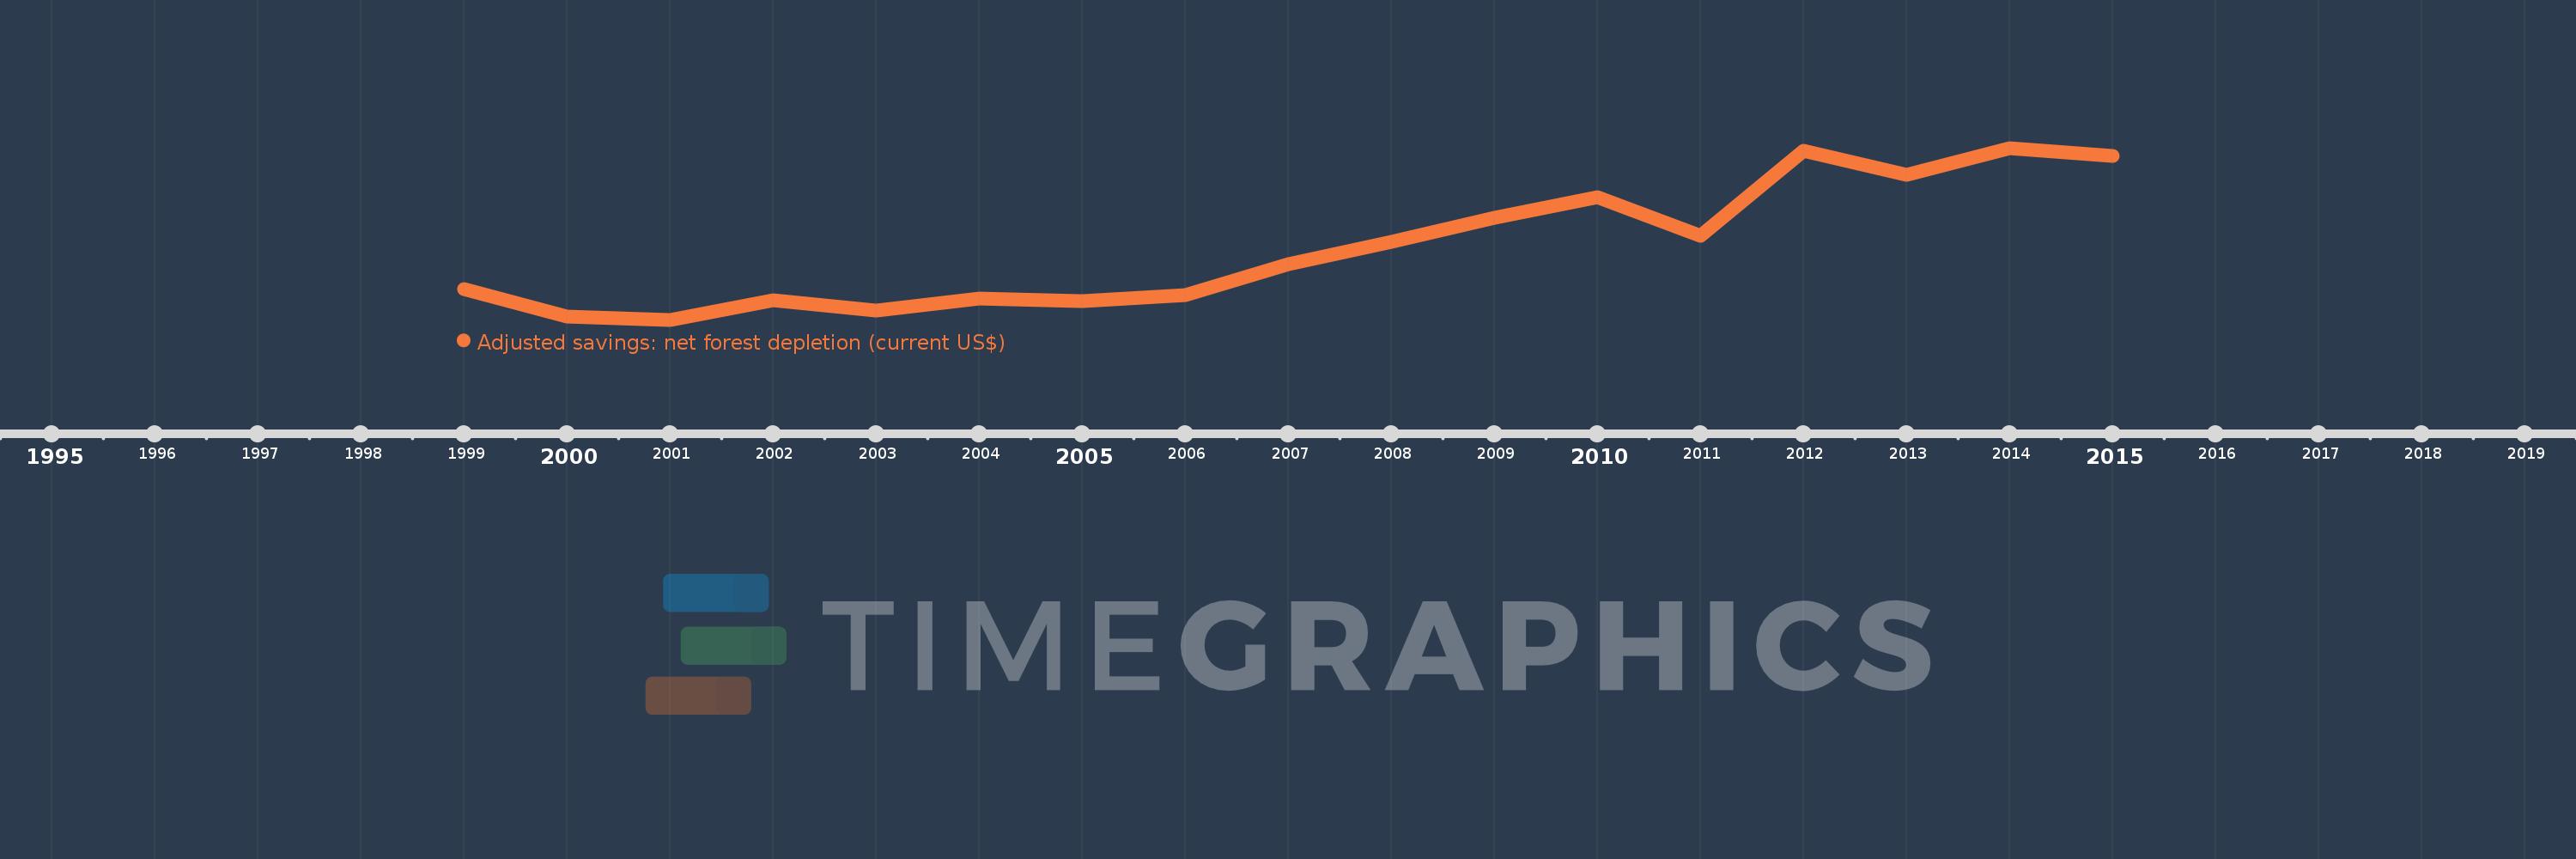
This timeline shows a graph from 1999 to 2015 of Uzbekistan. No data until 1998. Number of actual observations by date: 17.
Source name:
World Development Indicators
Source organization:
World Bank staff estimates based on sources and methods in World Bank's "The Changing Wealth of Nations: Measuring Sustainable Development in the New Millennium" (2011).
Categories, topics:
Economy & Growth, Environment
Last updated:
apr 23, 2017
Indicators value changes by year
Meaning:
705.161K
Minimum:
341.353K
jan 1, 2001
Maximum:
1.213 mln
jan 1, 2014
At the date of observation
Value
Absolute change
Change from the previous value
jan 1, 1999
496.426K
+496.426K
0.0%
jan 1, 2000
357.446K
-138.98K
-28.0%
jan 1, 2001
341.353K
-16.094K
-4.5%
jan 1, 2002
439.741K
+98.388K
28.82%
jan 1, 2003
390.047K
-49.694K
-11.3%
jan 1, 2004
450.728K
+60.681K
15.56%
jan 1, 2005
435.799K
-14.928K
-3.31%
jan 1, 2006
468.088K
+32.289K
7.41%
jan 1, 2007
622.732K
+154.644K
33.04%
jan 1, 2008
737.758K
+115.026K
18.47%
jan 1, 2009
857.507K
+119.749K
16.23%
jan 1, 2010
962.183K
+104.676K
12.21%
jan 1, 2011
766.252K
-195.931K
-20.36%
jan 1, 2012
1.197 mln
+431.22K
56.28%
jan 1, 2013
1.077 mln
-120.001K
-10.02%
jan 1, 2014
1.213 mln
+135.348K
12.56%
jan 1, 2015
1.174 mln
-38.904K
-3.21%
Ranking of countries by current statistics by years