33
/
AIzaSyB4mHJ5NPEv-XzF7P6NDYXjlkCWaeKw5bc
November 30, 2025
70176
Argentina
ARG
true
2
1
Net current transfers from abroad (constant LCU)
2007,2006,2005,2004,2003,2002,2001,2000,1999,1998,1997,1996,1995,1994,1993,1992
Create a timeline
Public Timelines
For education
For educational institutions
For teachers
For students
Cabinet
For educational institutions
For teachers
For students
Open cabinet
FAQ
Close
Create a timeline
Public timelines
FAQ
About & Feedback
Terms
Privacy
FAQ
Support 24/7
Cabinet
Get premium
Donate
Download
Global statistics library
→
Argentina
→
Net current transfers from abroad (constant LCU)
This statistics in other country:
Albania
Algeria
Argentina
Armenia
Austria
Azerbaijan
Bahamas, The
Bangladesh
Barbados
Belarus
Belgium
Belize
Benin
Bhutan
Bolivia
Bosnia and Herzegovina
Botswana
Brazil
Bulgaria
Burkina Faso
Burundi
Cambodia
Cameroon
Canada
Central African Republic
Chad
Chile
China
Colombia
Comoros
Congo, Rep.
Costa Rica
Cote d'Ivoire
Croatia
Cyprus
Czech Republic
Denmark
Djibouti
Dominican Republic
Ecuador
Egypt, Arab Rep.
El Salvador
Eritrea
Estonia
Ethiopia
Finland
France
Gabon
Gambia, The
Germany
Ghana
Greece
Guatemala
Guinea
Honduras
Hungary
Iceland
Iran, Islamic Rep.
Ireland
Israel
Italy
Jamaica
Japan
Jordan
Kazakhstan
Kenya
Kyrgyz Republic
Lao PDR
Lebanon
Lesotho
Liberia
Luxembourg
Macedonia, FYR
Madagascar
Malawi
Mali
Mauritania
Mauritius
Mexico
Mongolia
Montenegro
Morocco
Mozambique
Namibia
Nepal
Netherlands
New Zealand
Nicaragua
Niger
Nigeria
Norway
Pakistan
Panama
Papua New Guinea
Paraguay
Peru
Philippines
Portugal
Romania
Russian Federation
Rwanda
Senegal
Serbia
Sierra Leone
Slovak Republic
South Africa
South Sudan
Spain
Sri Lanka
Sudan
Swaziland
Sweden
Switzerland
Syrian Arab Republic
Tajikistan
Tanzania
Thailand
Togo
Trinidad and Tobago
Turkey
Turkmenistan
Uganda
Ukraine
United Kingdom
United States
Uruguay
Uzbekistan
Venezuela, RB
West Bank and Gaza
Zambia
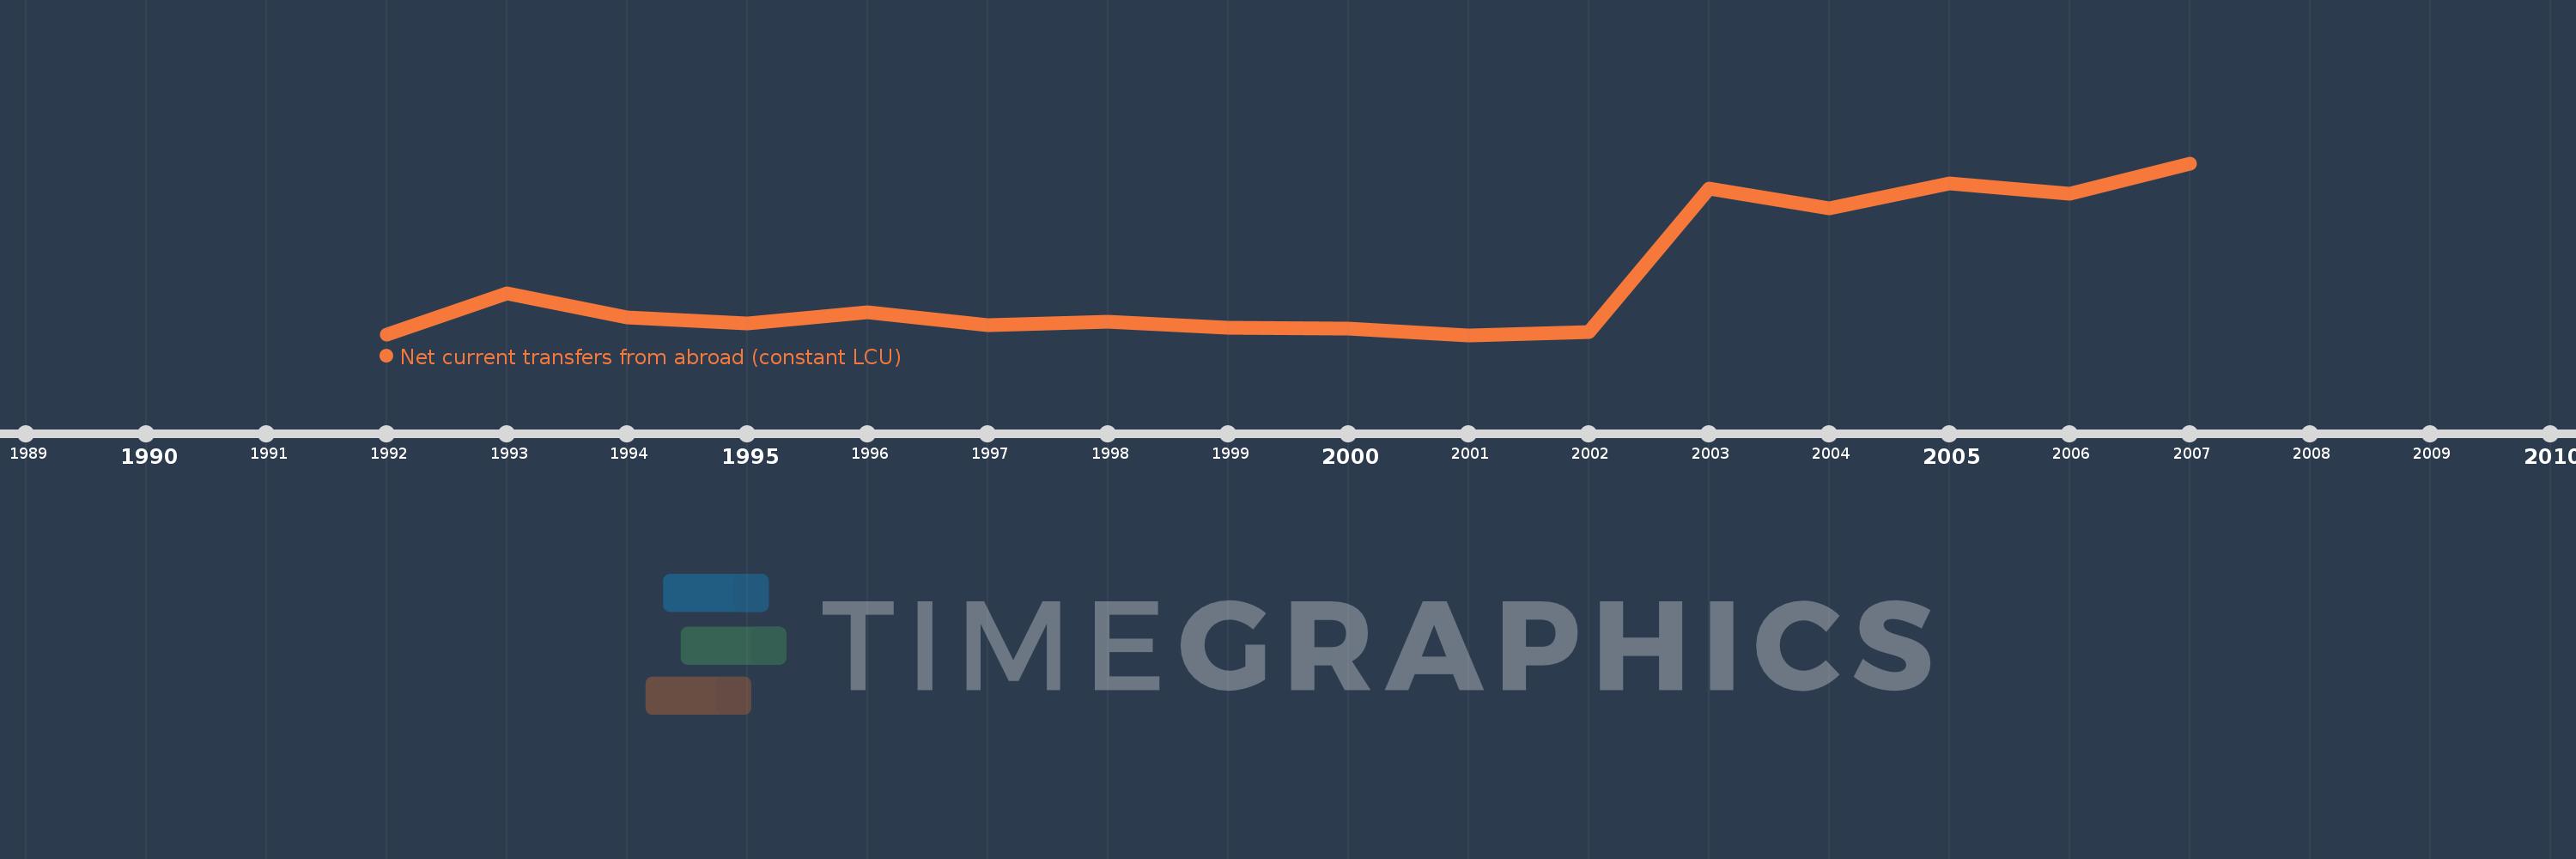
Timeline:
This timeline shows a graph from
1992
to
2007
of Argentina. No data until
1991
. Number of actual observations by date:
16
.
Source name:
World Development Indicators
Source organization:
World Bank national accounts data, and OECD National Accounts data files.
Categories, topics:
Economy & Growth
Last updated:
apr 23, 2017
Indicators value changes by year
Meaning:
874.971 mln
Minimum:
399.036 mln
jan 1, 2001
Maximum:
1.903 bln
jan 1, 2007
At the date of observation
Value
Absolute change
Change from the previous value
jan 1, 1992
400.684 mln
+400.684 mln
0.0%
jan 1, 1993
762.695 mln
+362.011 mln
90.35%
jan 1, 1994
552.2 mln
-210.495 mln
-27.6%
jan 1, 1995
497.2 mln
-55.0 mln
-9.96%
jan 1, 1996
596.8 mln
+99.6 mln
20.03%
jan 1, 1997
482.2 mln
-114.6 mln
-19.2%
jan 1, 1998
514.858 mln
+32.658 mln
6.77%
jan 1, 1999
464.068 mln
-50.789 mln
-9.86%
jan 1, 2000
453.31 mln
-10.758 mln
-2.32%
jan 1, 2001
399.036 mln
-54.274 mln
-11.97%
jan 1, 2002
424.495 mln
+25.459 mln
6.38%
jan 1, 2003
1.68 bln
+1.255 bln
295.68%
jan 1, 2004
1.505 bln
-174.959 mln
-10.42%
jan 1, 2005
1.726 bln
+221.151 mln
14.7%
jan 1, 2006
1.639 bln
-87.339 mln
-5.06%
jan 1, 2007
1.903 bln
+264.814 mln
16.16%
Ranking of countries by current statistics by years
About & Feedback
Terms
Privacy
FAQ
Support 24/7
Cabinet
Get premium
Donate
The service accepts bank transfer (ACH, Wire) or cards (Visa, MasterCard, etc). Processed by Stripe.
Secured with SSL